.svg)

Procurement 101: Economic Order Quantity (EOQ) Model – How it works
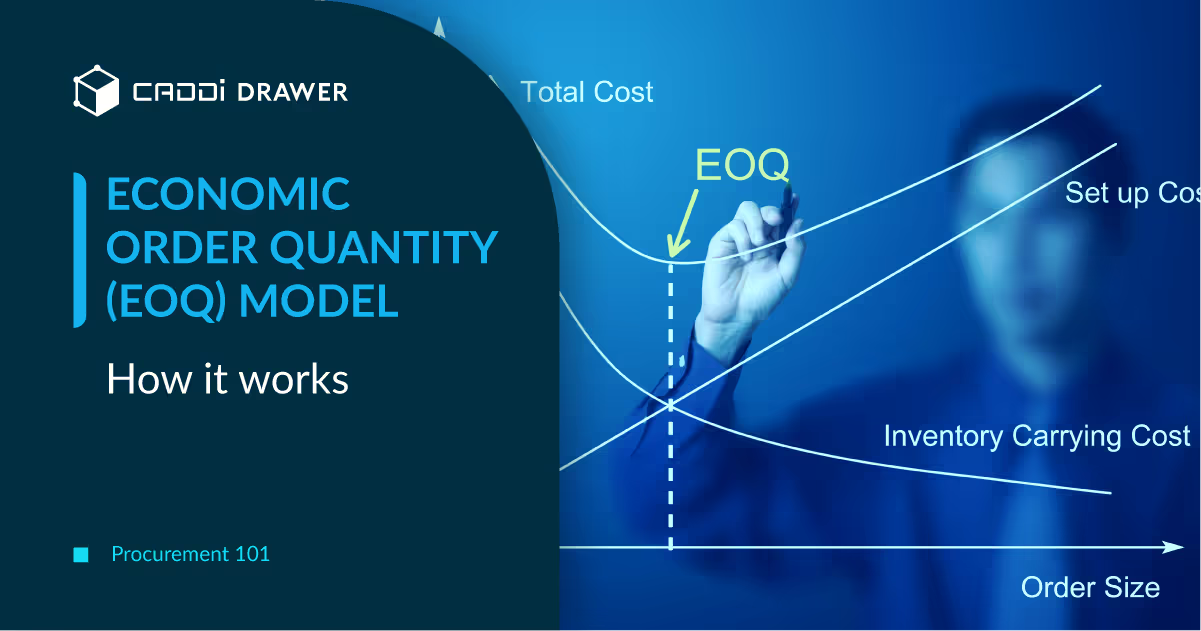
Table of Contents

Struggling to balance your inventory without overspending or running short? The Economic Order Quantity (EOQ) model could be your guide through the inventory management maze, offering a proven formula to cut costs and boost efficiency.
However, it must be said that the classical EOQ calculation model is outdated. This is because it is rooted in a “static” perspective, assuming that future demand is completely understood and constant. Nowadays, approaches based on more probabilistic demand forecasting are used.
That said, this does not mean that understanding EOQ is pointless. Grasping its basic concepts, the limitations of the model, and its derivatives based on these limitations lays the foundation for understanding more advanced approaches. Below, these will be explained.
Understanding EOQ and Its Importance
EOQ is about finding that sweet spot—the optimal order quantity that minimizes costs without compromising operational efficacy. It’s a delicate balancing act that procurement managers and supply chain professionals navigate daily.
The importance of EOQ in this high-stakes environment cannot be overstated, as it directly impacts a company’s bottom line through:
- Cost Reduction in Holding Inventory: By pinpointing the optimal order size, EOQ significantly cuts down the expenses tied to overstocking, such as storage fees and the risk of obsolescence.
- Minimizing Order Quantity and Order Costs: This model helps businesses order just enough inventory, taking full advantage of economies of scale and reducing order-related expenses.
- Maximizing Operational Efficiency: EOQ ensures that inventory levels are just right—avoiding both shortages and surpluses—thereby smoothing out the supply chain operations and satisfying customer demands promptly.
These benefits are not just theoretical. They are practical, measurable, and crucial for businesses aiming to stay competitive in today’s fast-paced market.
The EOQ Formula Explained
Diving into the mechanics of the EOQ model reveals a formula that might seem daunting at first glance but is fundamentally about balance. The formula, √2DS/H, where D is the annual demand, S is the ordering cost per order, and H is the holding cost per unit per year, is the cornerstone of EOQ. Let’s break it down:
- D (Annual Demand): The total quantity needed over a year.
- S (Ordering Cost): Costs associated with placing an order, irrespective of the order size.
- H (Holding Cost): The cost to keep inventory in stock, including storage, insurance, and depreciation.
By applying this formula, businesses can determine the most cost-effective quantity to order at any given time. Consider a practical example: a company faces an annual demand of 10,000 units, with each order incurring a $100 cost and each unit costing $0.50 to hold per year.
Utilizing the EOQ formula, the company can calculate the exact number of units in order to minimize costs while ensuring they meet demand efficiently. This mathematical precision removes much of the guesswork from inventory management, providing a clear pathway to optimized operations and reduced waste.
EOQ in Practice
The true test of any model lies in its application. The EOQ model, when applied with insight and flexibility, can offer significant benefits:
- Inventory Reorder Point: EOQ helps determine when to reorder stock, ensuring businesses maintain optimal inventory levels without facing shortages or overages.
- Optimal Product Quantity: It identifies the most cost-effective order sizes, reducing the risk of dead stock and freeing up capital for other investments.
- Cost Minimization: By optimizing order sizes and frequencies, EOQ directly contributes to lowering both ordering and holding costs.
- Cash Flow Management: An efficient EOQ strategy improves cash flow by minimizing money tied up in inventory, allowing for more flexible financial planning.
Incorporating EOQ into procurement strategies requires a blend of analytical rigor and practical wisdom. It’s not about slavishly following a formula but about understanding its principles and applying them creatively to meet the unique challenges of each business. As the market evolves, so too must our approaches to inventory management, with EOQ serving as a valuable, though not exclusive, tool in that ongoing endeavor.
Limitations of the EOQ Model
Despite its utility, the EOQ model has its limitations, which are crucial for procurement managers to understand and navigate:
- Assumption of Constant Demand: EOQ’s foundation lies in stable demand predictions, a condition seldom met in the fluctuating markets of today.
- Fixed Costs Fallacy: The model assumes costs remain static, overlooking potential fluctuations in material costs or shipping fees.
- Single Product Focus: Calculating EOQ for each SKU individually can be a Herculean task for businesses with extensive product lines.
- External Factors Overlooked: Unforeseen events like supply chain disruptions or market shifts can throw EOQ calculations off balance.
Awareness of these constraints empowers businesses to use EOQ judiciously, combining it with other tools and strategies for a more holistic approach to inventory management.
Extensions and Variations of the EOQ Model
The EOQ model, while foundational, is not a one-size-fits-all solution. The business world is rife with complexity, and the basic EOQ model must be adapted to fit diverse scenarios. Advanced EOQ models take into account factors such as:
- Quantity Discount Models: These models adjust the basic EOQ to account for discounts on bulk orders, ensuring procurement managers can weigh the benefits of lower per-unit costs against the risks of overstocking.
- Production Run Models: Tailored for manufacturing settings, these models help optimize the schedule and quantity of production runs, balancing production costs against inventory holding costs.
- Reorder Point Models: Working in tandem with EOQ, these models determine the optimal moment to place a new order, factoring in lead times and safety stock to prevent stockouts.
- Stochastic Demand Models: For businesses facing unpredictable demand, these models incorporate probabilistic methods to forecast demand variability, aiding in more resilient inventory planning.
By exploring these extensions, businesses can refine their inventory management strategies, ensuring they remain agile and responsive to the ever-changing market dynamics.
How CADDi Drawer Can Help
CADDi Drawer, a cutting-edge digital platform designed for the manufacturing and procurement sectors, directly addresses the pressing challenges in data management within utilization of the EOQ model. Its capabilities can provide an innovative solution to many of the hurdles discussed earlier, particularly those related to data inconsistency, fragmentation, and the lack of a centralized system for data sharing and analysis.
Streamline activities in the procurement process
The following features enable you to streamline the time-consuming tasks of data collection and organization in procurement operations.
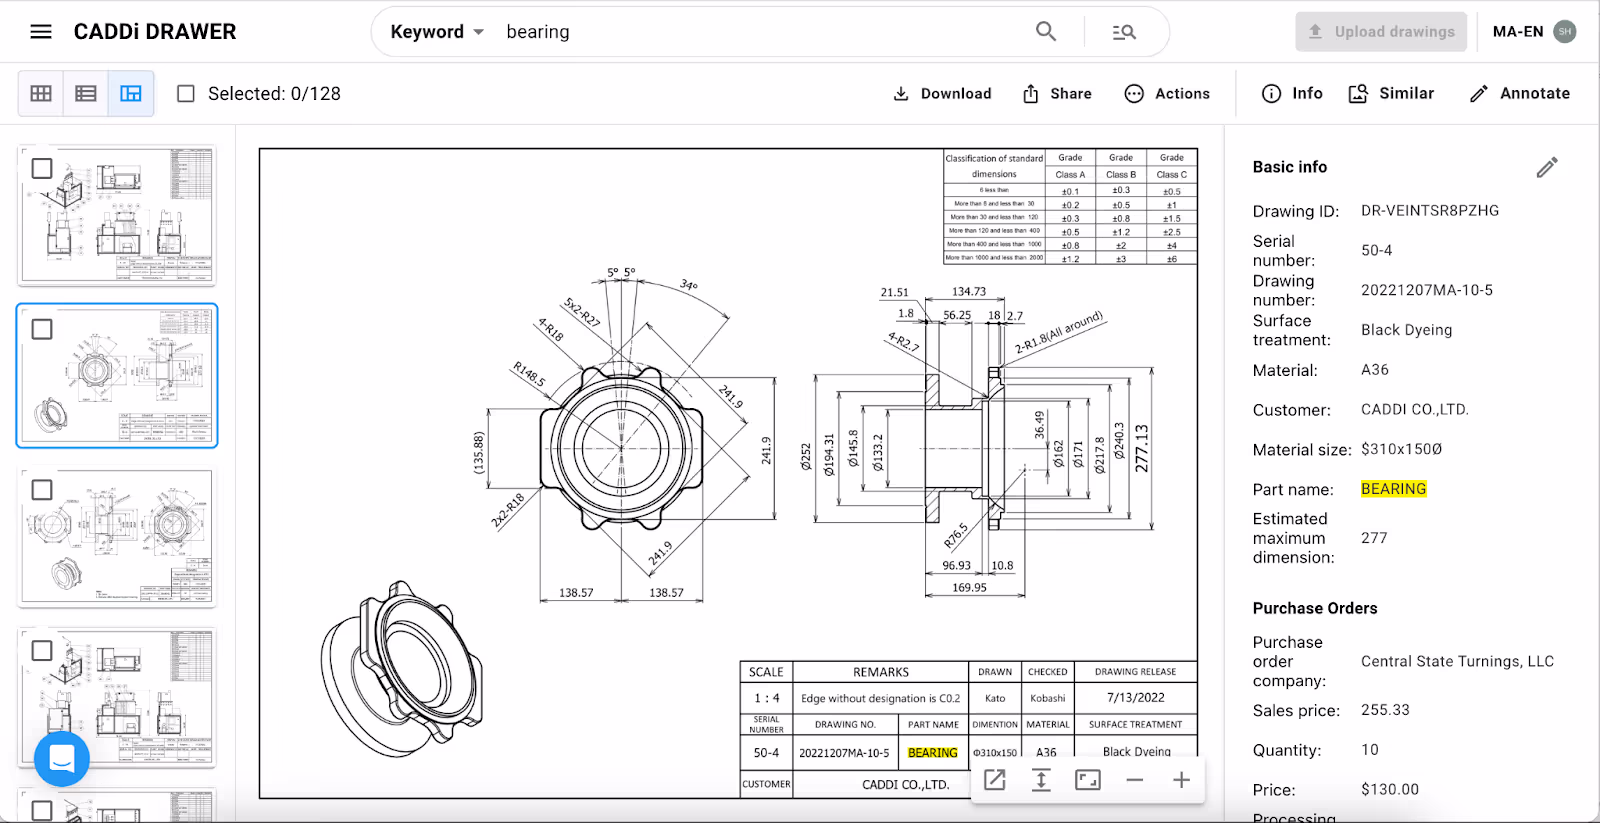
- Price data and supplier information can be automatically linked to each drawing and can also be exported together.
- By using keyword searches combined with similarity searches, the time spent searching for drawings and data in procurement tasks can be reduced.
Enhancing Collaboration and Standardization
Collaboration and standardization across the supply chain are crucial for overcoming visibility challenges. CADDi Drawer fosters collaboration by enabling easy sharing and access to data among all supply chain participants. This collaborative environment ensures that everyone is on the same page, enhancing coordination and efficiency. Additionally, the platform supports data standardization, which is vital for integrating data from diverse sources and ensuring that it is comparable and actionable.
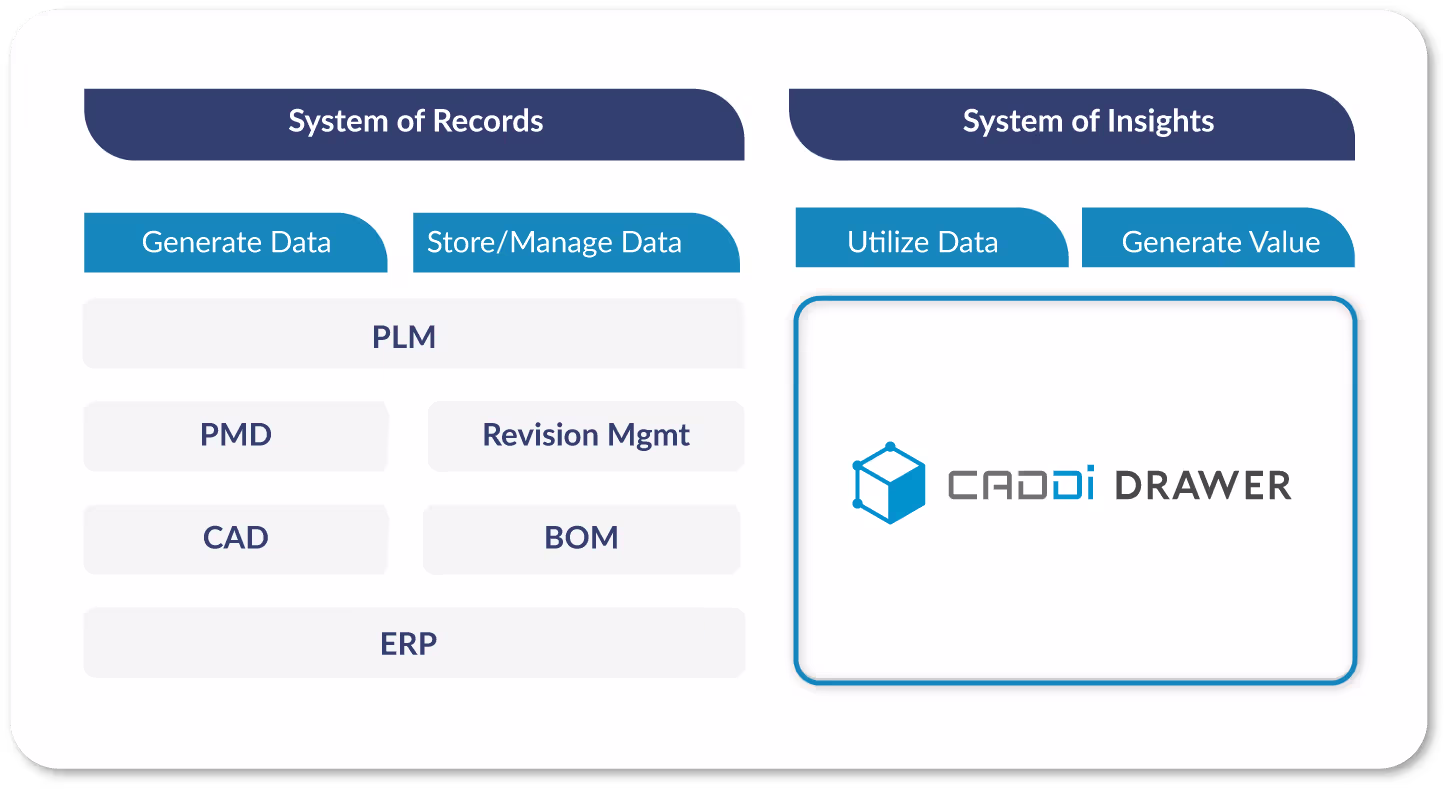
CADDi Drawer serves as a System of Insights (SoI), designed to leverage data primarily managed and stored by Systems of Records (SoR), like those represented by ERPs. Utilizing data stored in SoRs and data extracted and structured from drawings by CADDi Drawer, it supports procurement intelligence processes, including analyses and data processing for supplier selection and management, RFQ creation, and quote evaluations.
Struggling to balance your inventory without overspending or running short? The Economic Order Quantity (EOQ) model could be your guide through the inventory management maze, offering a proven formula to cut costs and boost efficiency.
However, it must be said that the classical EOQ calculation model is outdated. This is because it is rooted in a “static” perspective, assuming that future demand is completely understood and constant. Nowadays, approaches based on more probabilistic demand forecasting are used.
That said, this does not mean that understanding EOQ is pointless. Grasping its basic concepts, the limitations of the model, and its derivatives based on these limitations lays the foundation for understanding more advanced approaches. Below, these will be explained.
Understanding EOQ and Its Importance
EOQ is about finding that sweet spot—the optimal order quantity that minimizes costs without compromising operational efficacy. It’s a delicate balancing act that procurement managers and supply chain professionals navigate daily.
The importance of EOQ in this high-stakes environment cannot be overstated, as it directly impacts a company’s bottom line through:
- Cost Reduction in Holding Inventory: By pinpointing the optimal order size, EOQ significantly cuts down the expenses tied to overstocking, such as storage fees and the risk of obsolescence.
- Minimizing Order Quantity and Order Costs: This model helps businesses order just enough inventory, taking full advantage of economies of scale and reducing order-related expenses.
- Maximizing Operational Efficiency: EOQ ensures that inventory levels are just right—avoiding both shortages and surpluses—thereby smoothing out the supply chain operations and satisfying customer demands promptly.
These benefits are not just theoretical. They are practical, measurable, and crucial for businesses aiming to stay competitive in today’s fast-paced market.
The EOQ Formula Explained
Diving into the mechanics of the EOQ model reveals a formula that might seem daunting at first glance but is fundamentally about balance. The formula, √2DS/H, where D is the annual demand, S is the ordering cost per order, and H is the holding cost per unit per year, is the cornerstone of EOQ. Let’s break it down:
- D (Annual Demand): The total quantity needed over a year.
- S (Ordering Cost): Costs associated with placing an order, irrespective of the order size.
- H (Holding Cost): The cost to keep inventory in stock, including storage, insurance, and depreciation.
By applying this formula, businesses can determine the most cost-effective quantity to order at any given time. Consider a practical example: a company faces an annual demand of 10,000 units, with each order incurring a $100 cost and each unit costing $0.50 to hold per year.
Utilizing the EOQ formula, the company can calculate the exact number of units in order to minimize costs while ensuring they meet demand efficiently. This mathematical precision removes much of the guesswork from inventory management, providing a clear pathway to optimized operations and reduced waste.
EOQ in Practice
The true test of any model lies in its application. The EOQ model, when applied with insight and flexibility, can offer significant benefits:
- Inventory Reorder Point: EOQ helps determine when to reorder stock, ensuring businesses maintain optimal inventory levels without facing shortages or overages.
- Optimal Product Quantity: It identifies the most cost-effective order sizes, reducing the risk of dead stock and freeing up capital for other investments.
- Cost Minimization: By optimizing order sizes and frequencies, EOQ directly contributes to lowering both ordering and holding costs.
- Cash Flow Management: An efficient EOQ strategy improves cash flow by minimizing money tied up in inventory, allowing for more flexible financial planning.
Incorporating EOQ into procurement strategies requires a blend of analytical rigor and practical wisdom. It’s not about slavishly following a formula but about understanding its principles and applying them creatively to meet the unique challenges of each business. As the market evolves, so too must our approaches to inventory management, with EOQ serving as a valuable, though not exclusive, tool in that ongoing endeavor.
Limitations of the EOQ Model
Despite its utility, the EOQ model has its limitations, which are crucial for procurement managers to understand and navigate:
- Assumption of Constant Demand: EOQ’s foundation lies in stable demand predictions, a condition seldom met in the fluctuating markets of today.
- Fixed Costs Fallacy: The model assumes costs remain static, overlooking potential fluctuations in material costs or shipping fees.
- Single Product Focus: Calculating EOQ for each SKU individually can be a Herculean task for businesses with extensive product lines.
- External Factors Overlooked: Unforeseen events like supply chain disruptions or market shifts can throw EOQ calculations off balance.
Awareness of these constraints empowers businesses to use EOQ judiciously, combining it with other tools and strategies for a more holistic approach to inventory management.
Extensions and Variations of the EOQ Model
The EOQ model, while foundational, is not a one-size-fits-all solution. The business world is rife with complexity, and the basic EOQ model must be adapted to fit diverse scenarios. Advanced EOQ models take into account factors such as:
- Quantity Discount Models: These models adjust the basic EOQ to account for discounts on bulk orders, ensuring procurement managers can weigh the benefits of lower per-unit costs against the risks of overstocking.
- Production Run Models: Tailored for manufacturing settings, these models help optimize the schedule and quantity of production runs, balancing production costs against inventory holding costs.
- Reorder Point Models: Working in tandem with EOQ, these models determine the optimal moment to place a new order, factoring in lead times and safety stock to prevent stockouts.
- Stochastic Demand Models: For businesses facing unpredictable demand, these models incorporate probabilistic methods to forecast demand variability, aiding in more resilient inventory planning.
By exploring these extensions, businesses can refine their inventory management strategies, ensuring they remain agile and responsive to the ever-changing market dynamics.
How CADDi Drawer Can Help
CADDi Drawer, a cutting-edge digital platform designed for the manufacturing and procurement sectors, directly addresses the pressing challenges in data management within utilization of the EOQ model. Its capabilities can provide an innovative solution to many of the hurdles discussed earlier, particularly those related to data inconsistency, fragmentation, and the lack of a centralized system for data sharing and analysis.
Streamline activities in the procurement process
The following features enable you to streamline the time-consuming tasks of data collection and organization in procurement operations.
- Price data and supplier information can be automatically linked to each drawing and can also be exported together.
- By using keyword searches combined with similarity searches, the time spent searching for drawings and data in procurement tasks can be reduced.
Enhancing Collaboration and Standardization
Collaboration and standardization across the supply chain are crucial for overcoming visibility challenges. CADDi Drawer fosters collaboration by enabling easy sharing and access to data among all supply chain participants. This collaborative environment ensures that everyone is on the same page, enhancing coordination and efficiency. Additionally, the platform supports data standardization, which is vital for integrating data from diverse sources and ensuring that it is comparable and actionable.
CADDi Drawer serves as a System of Insights (SoI), designed to leverage data primarily managed and stored by Systems of Records (SoR), like those represented by ERPs. Utilizing data stored in SoRs and data extracted and structured from drawings by CADDi Drawer, it supports procurement intelligence processes, including analyses and data processing for supplier selection and management, RFQ creation, and quote evaluations.
Ready to see CADDi Drawer in action? Get a personalized demo.
Subscribe to our Blog!
.svg)
.svg)
.svg)

Related Resources