.svg)

Procurement 101: Spend Analysis – Practical guide to mastering it
Table of Contents

Introduction to Spend Analysis
Spend analysis is the process of examining and analyzing an organization’s spending data to identify opportunities for cost savings, process improvements, and better supplier management.
This guide will provide a practical overview of implementing spend analysis for manufacturing procurement. We’ll cover gathering and preparing expenditure data, using metrics and models for analysis, identifying savings opportunities, optimizing suppliers and contracts, forecasting future spend, and automating the process. Whether you’re new to spend analysis or looking to improve existing efforts, this guide will help you master this vital capability for manufacturing procurement success.
Gathering Data for Spend Analysis
Spend analysis relies on high quality data from various sources within the organization. The first step is identifying where the procurement and spend data exists. The main data sources are:
- ERP system: The organization’s Enterprise Resource Planning system contains purchasing data, supplier records, product information, invoices, and payment data. This provides the core transactional data needed for spend analysis.
- Procurement systems: These systems, which may be standalone or integrated with an ERP, contain data on supplier contracts, catalogs, and purchase requisitions.
- Accounts Payable Systems: The AP system includes invoice, payment, and remittance details. Matching AP data with purchase orders and goods receipts from the ERP provides deeper insights.
- Supplier databases: Maintaining a master supplier database allows linking supplier details like capabilities, locations, and performance to spend.
- Maintenance, Repair, and Operations systems: MRO systems provide data on indirect spending related to facility management, equipment maintenance, and office supplies.
Once data sources are identified, the next step is extracting the data on a periodic basis, ideally automatically. Typical extraction frequency is monthly or quarterly, as frequent refreshes allow insights into recent spend patterns.
The data then needs to be checked for quality and normalized to a standard dataset. Common data issues like duplicate records, incomplete data, and invalid entries must be identified and resolved. Useful methods include statistical analysis to identify outliers, data visualization to spot gaps or errors, and consulting with system owners to understand data nuances. Investing time in quality checks dramatically improves the accuracy of spend analysis.
The result is a clean spend data set from across the organization, ready for analysis and leading to data-driven procurement improvements.
Spend Analysis Metrics
Spend analysis reveals insights through key procurement metrics. Here are some of the most important metrics to track:
Spend by category: Breaking down spend by product or service category helps identify areas with the highest spend and potential for consolidation or strategic sourcing.
Spend by business unit: Analyzing spend by department or business unit can uncover differences in purchasing patterns and identify opportunities for standardization and economies of scale.
Supplier concentration: How much of total spend is concentrated with the top suppliers? High concentration levels mean risk from supplier failure but also negotiating leverage.
Purchase price variance: Are there instances where purchase prices lack consistency or deviate without justification, even for nearly identical items, depending on the buyer or supplier? Price variance for similar products is common, but these often present untapped cost reduction opportunities.
Total cost of ownership (TCO): Analyzing the full lifecycle costs of purchases, including price, transportation, inventory carrying costs, and maintenance, provides a more comprehensive view of spending.
Supplier performance: Tracking metrics such as on-time delivery, quality, and responsiveness can help identify top-performing suppliers and those that need improvement.
Spend under management: What percentage of total spend is under procurement’s active management through contracts and supplier relationships? Higher spend under management indicates greater visibility and control.
Payment terms: Assessing payment terms across suppliers can reveal opportunities to negotiate better terms, such as early payment discounts, to improve cash flow management.
Procurement can set targets for these metrics and regularly measure progress. For example, increasing spend under management to 80% of total spend or improving contract compliance to 95% of purchases. Tracking metrics over time shows the impact of procurement initiatives and opportunities for improvement.
Data Visualization
Data visualization is a critical component of spend analysis. By transforming spend data into graphs, charts, and other visual formats, procurement professionals can more easily identify patterns, trends, and insights.
The key is choosing visualizations that allow procurement professionals to easily spot patterns and tell stories from the data. Well-designed charts make spend anomalies jump out.
These are some best practices for effective data visualization in spend analysis:
- Focus visuals on key metrics and insights for your audience. Don’t overload with superfluous data.
- Keep visual designs simple and intuitive. Avoid cluttered or overly complex graphics.
- Structure dashboards to tell a data story from top to bottom. Visuals should flow logically.
- Use descriptive titles, legends, and labels. Visuals should be self-explanatory.
- Maintain consistency in design, fonts, color schemes, etc. to allow quick comparison.
- Visualize data over time to identify trends and changes. Static snapshots have limited value.
- Streamline data updates through automation or simplification. Avoid too complex data structures and time-consuming processes for each update or analysis.
With compelling data visualizations, procurement can turn abstract spend data into impactful business insights. The right visuals make spend patterns crystal clear.
Segmentation and Categorization
Spend analysis allows procurement teams to segment and categorize spending in order to gain further insights. There are two key methods for doing this:
Spend Segmentation
Spend can be segmented in different ways to identify areas of opportunity:
- Value segmentation: Spend is segmented by the total value of purchases in each category. This allows you to focus strategic sourcing and negotiation efforts on the largest areas of spend.
- Criticality segmentation: Spend is classified based on the importance and risk associated with each category. Critical spend segments require greater supplier management and risk mitigation.
- Demand segmentation: Spend is segmented by the level and variability of demand. This enables tailoring of procurement and inventory strategies based on demand patterns.
Item Categorization
Properly categorizing spend is essential for actionable analysis. Items should be grouped into standard, company-specific categories such as raw materials, processing methods, applications, quality requirements, quantity ranges, etc. Within these major categories, sub-categories can be used to provide greater granularity.
Careful spend segmentation and categorization enables refined insights from spend analysis. Companies can focus efforts on the largest, most critical, and most variable areas of expenditure.
The spend cube model is also a powerful tool for analyzing multiple procurement metrics simultaneously across time periods. By combining dimensions such as supplier, category, business unit, and time (e.g., monthly, quarterly, or annually), the model provides a comprehensive view of spending patterns and trends. This multi-dimensional analysis enables organizations to identify cost-saving opportunities, improve supplier management, optimize procurement strategies, and track performance over time.
Identifying Cost Savings Opportunities
One of the most valuable applications of spend analysis for procurement teams is uncovering opportunities to reduce costs. There are several techniques that can help identify potential savings:
Supplier Consolidation
Consolidating spend across fewer suppliers or contracts can increase buying power and economies of scale. Analyzing spend data can reveal areas where spend is fragmented across many suppliers, and consolidating this spend into strategic agreements with fewer preferred suppliers can result in lower unit costs and reduced procurement expenses.
Alternative Supplier Evaluation
Leveraging spend analysis to quantify purchasing volumes and specifications makes it easier to evaluate alternative suppliers and sourcing options through supplier selection. By breaking down current spend and pricing models, there may be opportunities to identify alternate suppliers that can meet requirements at a reduced total cost. Competitive bidding and reverse auctions can provide comparison points to negotiate improved contracts.
Price Benchmarking
In-depth spend analysis empowers procurement teams to negotiate better pricing with incumbent suppliers. Comparing prices paid versus internal and external benchmarks can uncover gaps. Documenting total spend volumes by product/service category also strengthens the buyer’s position during re-negotiations. By baselining prices and prioritizing categories with the largest savings potential, data-driven price benchmarking enables targeted negotiations to capture savings.
Spend analysis reveals insights that lead to quantifiable cost reduction opportunities. By consolidating suppliers, evaluating alternatives, and benchmarking pricing, manufacturers can strategically optimize spend to achieve measurable savings.
Leveraging Spend Analysis in Supplier Negotiations
Spend analysis helps optimize supplier relationships and contracts, reducing costs and improving performance. Key strategies include:
- Supplier rationalization: Consolidate spend with fewer, high-performing suppliers to create economies of scale and strategic partnerships.
- Multi-year contracts: Negotiate longer-term agreements for better pricing and terms, providing suppliers guaranteed business.
- Volume discounting: Leverage increased spend with preferred suppliers to secure higher volume discounts.
Leveraging spend analysis is crucial for organizations seeking to streamline their supply base, enhance supplier collaboration, and achieve long-term cost savings.
Automating Spend Analysis
Spend analysis can be a time-consuming manual process. However, procurement technology solutions are available to help automate parts of the analysis to gain efficiency.
Procurement intelligence software offers capabilities to take raw relevant data, cleanse and normalize it, categorize it, and generate visualizations and insights. This eliminates many manual steps in the initial stages of spend analysis. The software can pull data from multiple enterprise systems like ERPs, generate customized reports, and reveal patterns and opportunities.
Data integration is key to building a foundation for spend analytics. Rather than extracting data from different sources manually into spreadsheets, automated data integration tools can scheduled jobs to pull and consolidate relevant data into a central data warehouse. This provides clean, harmonized data for spend analytics.
Ongoing analytics workflow is enabled through automation. Once the analytics environment is established, algorithms can run on regular schedules to update dashboards, generate alerts, and populate reports. Procurement teams can be notified of changes that require their attention rather than manually producing reports.
By reducing the time spent on manual tasks, procurement groups can focus their efforts on strategy, supplier management, and negotiations to maximize the value delivered through spend analysis. Procurement analytics systems provide the data and insights for data-driven decision making.
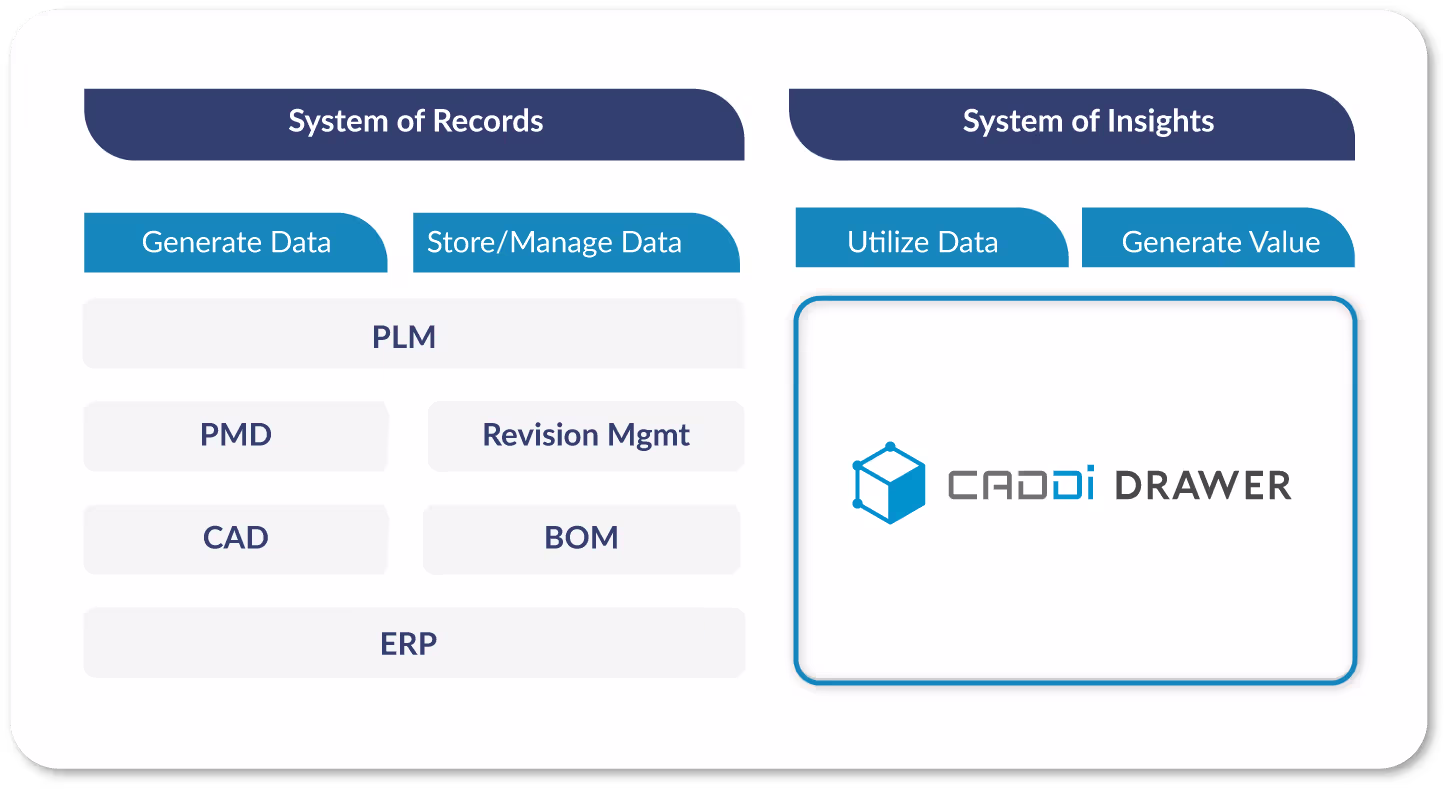
CADDi Drawer, a solution that fully supports procurement intelligence, data integration, and analytics workflow as a System of Insights (SoI). It leverages data from Systems of Records (SoR), such as ERPs, and extracts and structures data from drawings to support procurement processes, including supplier selection and management, RFQ creation, and quote evaluations.
Introduction to Spend Analysis
Spend analysis is the process of examining and analyzing an organization’s spending data to identify opportunities for cost savings, process improvements, and better supplier management.
This guide will provide a practical overview of implementing spend analysis for manufacturing procurement. We’ll cover gathering and preparing expenditure data, using metrics and models for analysis, identifying savings opportunities, optimizing suppliers and contracts, forecasting future spend, and automating the process. Whether you’re new to spend analysis or looking to improve existing efforts, this guide will help you master this vital capability for manufacturing procurement success.
Gathering Data for Spend Analysis
Spend analysis relies on high quality data from various sources within the organization. The first step is identifying where the procurement and spend data exists. The main data sources are:
- ERP system: The organization’s Enterprise Resource Planning system contains purchasing data, supplier records, product information, invoices, and payment data. This provides the core transactional data needed for spend analysis.
- Procurement systems: These systems, which may be standalone or integrated with an ERP, contain data on supplier contracts, catalogs, and purchase requisitions.
- Accounts Payable Systems: The AP system includes invoice, payment, and remittance details. Matching AP data with purchase orders and goods receipts from the ERP provides deeper insights.
- Supplier databases: Maintaining a master supplier database allows linking supplier details like capabilities, locations, and performance to spend.
- Maintenance, Repair, and Operations systems: MRO systems provide data on indirect spending related to facility management, equipment maintenance, and office supplies.
Once data sources are identified, the next step is extracting the data on a periodic basis, ideally automatically. Typical extraction frequency is monthly or quarterly, as frequent refreshes allow insights into recent spend patterns.
The data then needs to be checked for quality and normalized to a standard dataset. Common data issues like duplicate records, incomplete data, and invalid entries must be identified and resolved. Useful methods include statistical analysis to identify outliers, data visualization to spot gaps or errors, and consulting with system owners to understand data nuances. Investing time in quality checks dramatically improves the accuracy of spend analysis.
The result is a clean spend data set from across the organization, ready for analysis and leading to data-driven procurement improvements.
Spend Analysis Metrics
Spend analysis reveals insights through key procurement metrics. Here are some of the most important metrics to track:
Spend by category: Breaking down spend by product or service category helps identify areas with the highest spend and potential for consolidation or strategic sourcing.
Spend by business unit: Analyzing spend by department or business unit can uncover differences in purchasing patterns and identify opportunities for standardization and economies of scale.
Supplier concentration: How much of total spend is concentrated with the top suppliers? High concentration levels mean risk from supplier failure but also negotiating leverage.
Purchase price variance: Are there instances where purchase prices lack consistency or deviate without justification, even for nearly identical items, depending on the buyer or supplier? Price variance for similar products is common, but these often present untapped cost reduction opportunities.
Total cost of ownership (TCO): Analyzing the full lifecycle costs of purchases, including price, transportation, inventory carrying costs, and maintenance, provides a more comprehensive view of spending.
Supplier performance: Tracking metrics such as on-time delivery, quality, and responsiveness can help identify top-performing suppliers and those that need improvement.
Spend under management: What percentage of total spend is under procurement’s active management through contracts and supplier relationships? Higher spend under management indicates greater visibility and control.
Payment terms: Assessing payment terms across suppliers can reveal opportunities to negotiate better terms, such as early payment discounts, to improve cash flow management.
Procurement can set targets for these metrics and regularly measure progress. For example, increasing spend under management to 80% of total spend or improving contract compliance to 95% of purchases. Tracking metrics over time shows the impact of procurement initiatives and opportunities for improvement.
Data Visualization
Data visualization is a critical component of spend analysis. By transforming spend data into graphs, charts, and other visual formats, procurement professionals can more easily identify patterns, trends, and insights.
The key is choosing visualizations that allow procurement professionals to easily spot patterns and tell stories from the data. Well-designed charts make spend anomalies jump out.
These are some best practices for effective data visualization in spend analysis:
- Focus visuals on key metrics and insights for your audience. Don’t overload with superfluous data.
- Keep visual designs simple and intuitive. Avoid cluttered or overly complex graphics.
- Structure dashboards to tell a data story from top to bottom. Visuals should flow logically.
- Use descriptive titles, legends, and labels. Visuals should be self-explanatory.
- Maintain consistency in design, fonts, color schemes, etc. to allow quick comparison.
- Visualize data over time to identify trends and changes. Static snapshots have limited value.
- Streamline data updates through automation or simplification. Avoid too complex data structures and time-consuming processes for each update or analysis.
With compelling data visualizations, procurement can turn abstract spend data into impactful business insights. The right visuals make spend patterns crystal clear.
Segmentation and Categorization
Spend analysis allows procurement teams to segment and categorize spending in order to gain further insights. There are two key methods for doing this:
Spend Segmentation
Spend can be segmented in different ways to identify areas of opportunity:
- Value segmentation: Spend is segmented by the total value of purchases in each category. This allows you to focus strategic sourcing and negotiation efforts on the largest areas of spend.
- Criticality segmentation: Spend is classified based on the importance and risk associated with each category. Critical spend segments require greater supplier management and risk mitigation.
- Demand segmentation: Spend is segmented by the level and variability of demand. This enables tailoring of procurement and inventory strategies based on demand patterns.
Item Categorization
Properly categorizing spend is essential for actionable analysis. Items should be grouped into standard, company-specific categories such as raw materials, processing methods, applications, quality requirements, quantity ranges, etc. Within these major categories, sub-categories can be used to provide greater granularity.
Careful spend segmentation and categorization enables refined insights from spend analysis. Companies can focus efforts on the largest, most critical, and most variable areas of expenditure.
The spend cube model is also a powerful tool for analyzing multiple procurement metrics simultaneously across time periods. By combining dimensions such as supplier, category, business unit, and time (e.g., monthly, quarterly, or annually), the model provides a comprehensive view of spending patterns and trends. This multi-dimensional analysis enables organizations to identify cost-saving opportunities, improve supplier management, optimize procurement strategies, and track performance over time.
Identifying Cost Savings Opportunities
One of the most valuable applications of spend analysis for procurement teams is uncovering opportunities to reduce costs. There are several techniques that can help identify potential savings:
Supplier Consolidation
Consolidating spend across fewer suppliers or contracts can increase buying power and economies of scale. Analyzing spend data can reveal areas where spend is fragmented across many suppliers, and consolidating this spend into strategic agreements with fewer preferred suppliers can result in lower unit costs and reduced procurement expenses.
Alternative Supplier Evaluation
Leveraging spend analysis to quantify purchasing volumes and specifications makes it easier to evaluate alternative suppliers and sourcing options through supplier selection. By breaking down current spend and pricing models, there may be opportunities to identify alternate suppliers that can meet requirements at a reduced total cost. Competitive bidding and reverse auctions can provide comparison points to negotiate improved contracts.
Price Benchmarking
In-depth spend analysis empowers procurement teams to negotiate better pricing with incumbent suppliers. Comparing prices paid versus internal and external benchmarks can uncover gaps. Documenting total spend volumes by product/service category also strengthens the buyer’s position during re-negotiations. By baselining prices and prioritizing categories with the largest savings potential, data-driven price benchmarking enables targeted negotiations to capture savings.
Spend analysis reveals insights that lead to quantifiable cost reduction opportunities. By consolidating suppliers, evaluating alternatives, and benchmarking pricing, manufacturers can strategically optimize spend to achieve measurable savings.
Leveraging Spend Analysis in Supplier Negotiations
Spend analysis helps optimize supplier relationships and contracts, reducing costs and improving performance. Key strategies include:
- Supplier rationalization: Consolidate spend with fewer, high-performing suppliers to create economies of scale and strategic partnerships.
- Multi-year contracts: Negotiate longer-term agreements for better pricing and terms, providing suppliers guaranteed business.
- Volume discounting: Leverage increased spend with preferred suppliers to secure higher volume discounts.
Leveraging spend analysis is crucial for organizations seeking to streamline their supply base, enhance supplier collaboration, and achieve long-term cost savings.
Automating Spend Analysis
Spend analysis can be a time-consuming manual process. However, procurement technology solutions are available to help automate parts of the analysis to gain efficiency.
Procurement intelligence software offers capabilities to take raw relevant data, cleanse and normalize it, categorize it, and generate visualizations and insights. This eliminates many manual steps in the initial stages of spend analysis. The software can pull data from multiple enterprise systems like ERPs, generate customized reports, and reveal patterns and opportunities.
Data integration is key to building a foundation for spend analytics. Rather than extracting data from different sources manually into spreadsheets, automated data integration tools can scheduled jobs to pull and consolidate relevant data into a central data warehouse. This provides clean, harmonized data for spend analytics.
Ongoing analytics workflow is enabled through automation. Once the analytics environment is established, algorithms can run on regular schedules to update dashboards, generate alerts, and populate reports. Procurement teams can be notified of changes that require their attention rather than manually producing reports.
By reducing the time spent on manual tasks, procurement groups can focus their efforts on strategy, supplier management, and negotiations to maximize the value delivered through spend analysis. Procurement analytics systems provide the data and insights for data-driven decision making.
CADDi Drawer, a solution that fully supports procurement intelligence, data integration, and analytics workflow as a System of Insights (SoI). It leverages data from Systems of Records (SoR), such as ERPs, and extracts and structures data from drawings to support procurement processes, including supplier selection and management, RFQ creation, and quote evaluations.
Ready to see CADDi Drawer in action? Get a personalized demo.
Subscribe to our Blog!
.svg)
.svg)
.svg)

Related Resources