.svg)

Cost Driver Analysis: A Procurement Guide to Understanding What's Driving Your Costs
Table of Contents

What Is Cost Driver Analysis? Definition and Purpose
Cost driver analysis (CDA) is a structured method for identifying the underlying factors that determine the price of a purchased part or service. Rather than accepting a supplier's quote at face value, procurement teams use cost driver analysis to break down costs into their root components — material, labor, overhead, tooling, and logistics — and understand exactly where the money is going. This visibility is the foundation of smarter negotiation, better should-cost modeling, and sustainable cost reduction.
CDA involves reviewing costs within different departments, product lines, processes or other activities. The aim is to trace costs back to their root causes. These root causes are the “cost drivers” – the factors that are driving costs up or down.
Some examples of common cost drivers:
- Labor rates – Increases in hourly wages can drive up labor costs.
- Material costs – Rising prices for raw materials or parts can increase production costs.
- Capacity utilization – Low capacity usage can result in high per-unit costs due to unused capacity.
- Product complexity – Products with more components and features often have higher unit costs.
CDA shines a light on the underlying factors impacting costs. This allows companies to take targeted actions to manage the cost drivers and optimize spending. Performing regular CDA is an important aspect of cost management and operational efficiency.
Advantage of Cost Driver Analysis for Procurement
Cost driver analysis (CDA) offers several unique advantages compared to other analytical methods used by procurement departments:
- Root cause identification – CDA delves deeper than traditional spend analysis by identifying the underlying factors driving costs. By understanding root causes, procurement can address issues at their source rather than simply treating symptoms.
- Predictive power – Regression analysis used in CDA can uncover correlations between cost drivers and total costs. This enables procurement to predict future costs based on expected changes in key cost drivers, enhancing budgeting and forecasting accuracy.
- Actionable insights – CDA pinpoints specific cost drivers that procurement can influence, such as order quantity, specification complexity, or supplier location. This provides clear direction on where to focus cost reduction efforts for maximum impact.
- Supplier negotiation support – By quantifying the impact of cost drivers, CDA arms procurement with data to negotiate more effectively with suppliers. For example, demonstrating how order quantity impacts unit price can justify volume discounts.
- Continuous improvement – CDA supports ongoing cost optimization by identifying new cost drivers as business conditions change. Regular analysis keeps procurement focused on the most impactful drivers over time.
While spend analysis and other methods are valuable, CDA offers a unique lens for procurement to identify and address the root causes of costs. By leveraging CDA, procurement can drive more strategic, data-driven decisions to optimize costs and deliver bottom-line results.
How to Conduct a Cost Driver Analysis: Step by Step
Conducting a cost driver analysis involves gathering data, quantifying cost drivers, developing a cost model, and implementing changes. Here are the key steps:
Identify Cost Drivers
Analyzing your company’s data to identify key activities that drive costs is a critical first step in cost driver analysis. Look at expenses across departments to find correlations between costs and specific activities. For example, the number of shipments made or service calls completed may correlate closely with logistics or customer service costs respectively.
Evaluate upstream factors as well. The type of packaging used can influence shipping costs downstream. Carefully examine all inputs and processes to determine which have an outsized impact on expenses. Rank cost drivers by the size of their influence on overall costs. Focusing CDA efforts on the most significant cost drivers will lead to greater impact.
Quantify Cost Driver Impact
Once you’ve identified the key cost drivers, the next step is to analyze historical data to quantify the impact of each driver. This allows you to estimate how changes in the drivers will affect total costs. There are several statistical methods that can be used:
- Regression analysis – This estimates the mathematical relationship between costs and cost drivers. By running regressions on historical data, you can quantify the impact of each driver. The regression coefficients show the cost impact of a 1 unit change in each driver.
- Analysis of Variance (ANOVA) – Analysis of variance allows you to estimate how much of the total variability in costs is explained by each cost driver. This indicates the relative importance of each driver.
- Correlation analysis – Examining the correlation coefficients between drivers and costs indicates the strength of the linear relationship. Drivers with higher correlations have a bigger cost impact.
- Sensitivity analysis – Varying the drivers within a plausible range provides a sensitivity analysis. This shows how costs change in response to changes in the drivers.
- Contribution analysis – This estimates each driver’s proportional contribution to total costs. It sums the products of each driver volume and the driver rate per unit.
Quantifying the cost drivers allows you to focus your efforts on the factors with the biggest impact. The statistical results provide the foundation for building a cost forecasting model.
Develop Cost Driver Model
Building a quantitative cost driver model is key to predicting how costs will change based on different activity levels. Here are the steps to develop an effective cost driver model:
- Identify the major activities that drive costs for the process you are analyzing. Common examples include number of material purchases, machine setups, inspections, shipments, and labor hours.
- Determine how the cost of each activity can be quantified. For labor, this may be the fully loaded hourly rate. For materials, it could be cost per unit purchased.
- Calculate the cost per unit of each cost driver. Divide the total cost of each activity by its volume to derive a cost per unit.
- Multiply the cost per unit by the number of units to estimate the total cost for different activity levels. For example, if a setup costs $200 and there are 25 setups, the total setup cost is 25 * $200 = $5,000.
- Build these factors for each cost driver into a model that allows you to flex the inputs and see the cost impact. Use spreadsheet software to create a user-friendly cost driver model.
- Validate the model by inputting actual volumes and costs from the baseline period and confirming the cost totals match real results. Refine as needed until the model reliably predicts costs.
- Use the model to estimate costs based on projected activity levels. Input potential future volumes and analyze different what-if scenarios.
- Update the model as new data becomes available. Cost driver relationships can change over time so revalidate and recalibrate regularly.
An accurate cost driver model provides a fact-based tool to quantify how costs are impacted by operating decisions and activities. Building one is an essential step to making data-driven decisions to optimize costs.
Implement Changes
Once you’ve identified the key cost drivers and quantified their impact, it’s time to implement changes to reduce costs related to those drivers. Here are some ways to go about this:
- Process improvements: Look for ways to increase efficiency and productivity in your processes. This could involve things like automating manual tasks, streamlining workflows, reducing errors and waste, etc. The goal is to get more output with less input.
- Supplier negotiations: Renegotiate pricing and contracts with suppliers associated with major cost drivers. See if you can get bulk discounts, reduced fees, or improved payment terms.
- Organization changes: Restructure your organization in a way that addresses cost driver issues. For example, centralizing certain functions to achieve economies of scale.
- Product redesign: Change product specifications, components, or packaging to lower production and material costs. Value engineering and redesign can yield significant savings.
- Resource reduction: Scale back usage of expensive resources linked to cost drivers. This may involve things like reducing excess inventory, cutting back on certain raw materials, decreasing equipment runtime, etc.
- Process outsourcing: Consider outsourcing processes tied to major cost drivers to external providers who can do it cheaper. But weigh all pros and cons first.
- Overhead cuts: Look for ways to reduce overhead expenses related to top cost drivers. For instance, facilities, utilities, management labor, etc.
The key is to take targeted actions that focus on the biggest cost drivers first. Continuously track results and tweak your improvement efforts along the way. Cost savings will quickly add up.
Track Results
After making changes based on your cost driver analysis, it’s crucial to track results and measure the impact. Focus on key performance indicators (KPIs) most relevant to the cost drivers you analyzed. Some examples include:
- Total cost per unit
- Cost of goods sold
- Direct material costs
- Direct labor costs
- Manufacturing overhead costs
- Units produced
- Scrap and rework
- Inventory turns
- Capacity utilization
- Customer retention/satisfaction
Carefully monitor these KPIs over time after implementing changes to quantify the impact on costs. Compare to historical benchmarks and target goals. Continuously refine your cost driver model based on measured results. This will allow you to optimize operations, processes, and spending for maximum cost reduction and efficiency.
Sustained tracking provides critical insights for continuous improvement. Cost driver analysis is an iterative process, not a one-time project. Commit to ongoing measurement so you can keep costs under control while adapting to evolving business conditions.
Continuous Improvement
Ongoing improvement is essential for cost driver analysis to remain effective over time. As circumstances change, the variables impacting costs are likely to evolve as well. Companies should have processes in place to continually gather updated data and input this into the cost driver model.
Regularly reviewing the latest data enables identification of when certain cost drivers have become more or less important. This allows refinement of the model to reflect the current situation. Without this ongoing overhaul of the underlying algorithms and weightings, the model risks becoming outdated and inaccurate. Frequent calibration keeps the analysis tuned to the present operational context.
Continuous improvement should involve the following practices:
- Regularly collecting new data on cost drivers. This may be daily, weekly or monthly based on business needs.
- Inputting updated figures into the model. Assess if any cost drivers now have a higher or lower impact.
- Adjusting the model as required based on changes in cost driver impact over time. Certain drivers may increase or decrease in significance.
- Reviewing outcomes to validate that the model still predicts costs accurately. Monitor for any deviations.
- Validating that assumed cost savings from interventions are realized. Track actual savings against projections.
- Identifying new improvement opportunities based on the revised model and data.
- Updating executives and stakeholders with the latest analysis on a frequent basis. Maintain visibility on how cost drivers are evolving.
Continuous improvement ensures cost driver analysis provides maximum value over the long-term. The model remains relevant by keeping pace with changes in the business environment. Regularly reviewing data and refining the algorithms sustains accuracy and optimization. Ongoing enhancement is key for lasting benefits.
Cost Driver Analysis in Supplier Negotiations: Turning Data Into Leverage
In summary, cost driver analysis is an important process for understanding the key factors impacting an organization’s costs. By systematically analyzing cost drivers, companies can gain visibility into what is truly driving spending and make informed decisions about how to reduce costs and operate more efficiently.
The key benefits of effective cost driver analysis include:
- Identifying opportunities for cost reduction and process improvements
- Allowing organizations to focus their efforts on the most impactful cost drivers
- Enabling data-driven decision making about costs rather than relying on assumptions
- Providing ongoing insights through continuous tracking and monitoring of cost drivers
- Supporting strategic planning and budgeting based on predicted impacts of cost drivers
Overall, mastering cost driver analysis helps organizations proactively manage their costs rather than being surprised by unexpected variances. Companies that institutionalize regular analysis and monitoring of cost drivers put themselves in a strong position to control spending, maximize efficiency, and drive profitability over the long-term.
One of the most actionable applications of cost driver analysis is in supplier negotiations. When procurement teams can show a supplier exactly which cost drivers are out of line — an unnecessarily tight tolerance adding 15% to machining time, for example, or a material grade that's over-specified for the application — the conversation shifts from price-haggling to problem-solving. Suppliers are often willing to work collaboratively on cost reduction when the analysis is specific and data-backed.
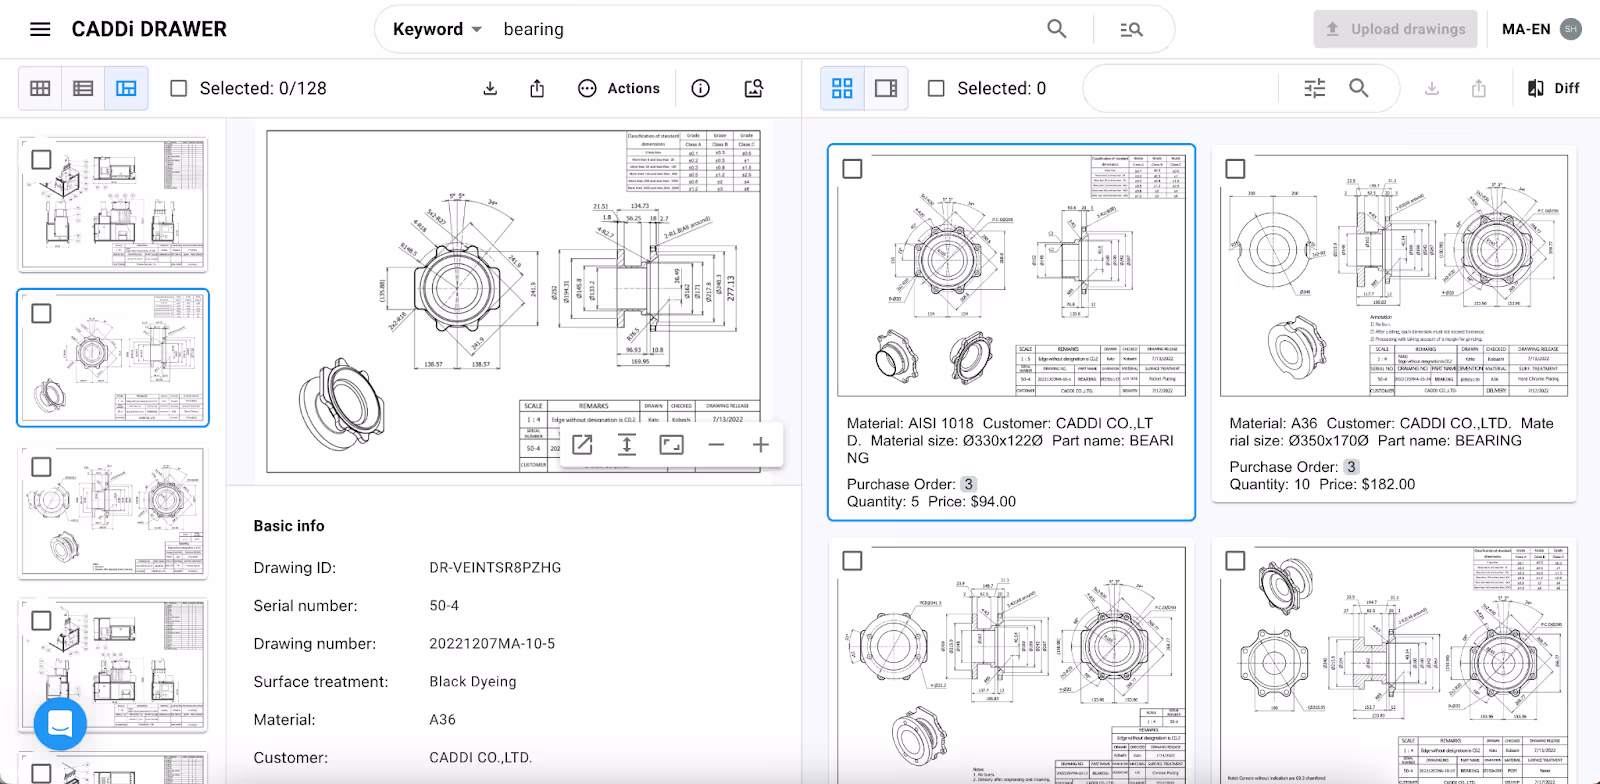
For manufactured components, engineering drawings are a critical but underused input in cost driver analysis. Drawings contain the tolerance requirements, material specifications, surface finish designations, and geometric complexity that drive manufacturing cost — data that's rarely captured in ERP systems. Organizations that connect drawing data to purchasing records gain a significant advantage: they can correlate design decisions directly with cost outcomes, and flag over-engineered specifications before they become a negotiation blind spot.
One of the solutions that cover the general use cases is CADDi Drawer, which:
- Extracts information from drawings, which are image files, i.e., unstructured data that need to be handled and viewed by people, and converts it into structured data.
- Associates various information such as purchasing data, supplier data, quality and manufacturing-related documents with drawings, elevating information that is difficult to utilize when scattered into valuable data assets.
- Enables quick searching, grouping, listing, outputting, and further adding information to the accumulated data assets from various perspectives.
It may seem simple, but until now, there was no mechanism to achieve this. Considering the enormous amount of time procurement professionals have spent gathering, analyzing, and making judgments based on this data, one can imagine the magnitude of the impact.
These features provide powerful support for procurement professionals in the five use cases. Particularly powerful is the high-precision similarity search function. Unlike common image-based similarity judgments based solely on appearance, it recognizes the shapes of products and parts depicted in drawings before making similarity judgments, enabling it to find similar drawings that other software cannot extract.
This significantly streamlines the basic actions of cost driver analysis, such as grouping parts, gathering highly relevant past data, and constructing data-driven logic for analysis and negotiation.
What Is Cost Driver Analysis? Definition and Purpose
Cost driver analysis (CDA) is a structured method for identifying the underlying factors that determine the price of a purchased part or service. Rather than accepting a supplier's quote at face value, procurement teams use cost driver analysis to break down costs into their root components — material, labor, overhead, tooling, and logistics — and understand exactly where the money is going. This visibility is the foundation of smarter negotiation, better should-cost modeling, and sustainable cost reduction.
CDA involves reviewing costs within different departments, product lines, processes or other activities. The aim is to trace costs back to their root causes. These root causes are the “cost drivers” – the factors that are driving costs up or down.
Some examples of common cost drivers:
- Labor rates – Increases in hourly wages can drive up labor costs.
- Material costs – Rising prices for raw materials or parts can increase production costs.
- Capacity utilization – Low capacity usage can result in high per-unit costs due to unused capacity.
- Product complexity – Products with more components and features often have higher unit costs.
CDA shines a light on the underlying factors impacting costs. This allows companies to take targeted actions to manage the cost drivers and optimize spending. Performing regular CDA is an important aspect of cost management and operational efficiency.
Advantage of Cost Driver Analysis for Procurement
Cost driver analysis (CDA) offers several unique advantages compared to other analytical methods used by procurement departments:
- Root cause identification – CDA delves deeper than traditional spend analysis by identifying the underlying factors driving costs. By understanding root causes, procurement can address issues at their source rather than simply treating symptoms.
- Predictive power – Regression analysis used in CDA can uncover correlations between cost drivers and total costs. This enables procurement to predict future costs based on expected changes in key cost drivers, enhancing budgeting and forecasting accuracy.
- Actionable insights – CDA pinpoints specific cost drivers that procurement can influence, such as order quantity, specification complexity, or supplier location. This provides clear direction on where to focus cost reduction efforts for maximum impact.
- Supplier negotiation support – By quantifying the impact of cost drivers, CDA arms procurement with data to negotiate more effectively with suppliers. For example, demonstrating how order quantity impacts unit price can justify volume discounts.
- Continuous improvement – CDA supports ongoing cost optimization by identifying new cost drivers as business conditions change. Regular analysis keeps procurement focused on the most impactful drivers over time.
While spend analysis and other methods are valuable, CDA offers a unique lens for procurement to identify and address the root causes of costs. By leveraging CDA, procurement can drive more strategic, data-driven decisions to optimize costs and deliver bottom-line results.
How to Conduct a Cost Driver Analysis: Step by Step
Conducting a cost driver analysis involves gathering data, quantifying cost drivers, developing a cost model, and implementing changes. Here are the key steps:
Identify Cost Drivers
Analyzing your company’s data to identify key activities that drive costs is a critical first step in cost driver analysis. Look at expenses across departments to find correlations between costs and specific activities. For example, the number of shipments made or service calls completed may correlate closely with logistics or customer service costs respectively.
Evaluate upstream factors as well. The type of packaging used can influence shipping costs downstream. Carefully examine all inputs and processes to determine which have an outsized impact on expenses. Rank cost drivers by the size of their influence on overall costs. Focusing CDA efforts on the most significant cost drivers will lead to greater impact.
Quantify Cost Driver Impact
Once you’ve identified the key cost drivers, the next step is to analyze historical data to quantify the impact of each driver. This allows you to estimate how changes in the drivers will affect total costs. There are several statistical methods that can be used:
- Regression analysis – This estimates the mathematical relationship between costs and cost drivers. By running regressions on historical data, you can quantify the impact of each driver. The regression coefficients show the cost impact of a 1 unit change in each driver.
- Analysis of Variance (ANOVA) – Analysis of variance allows you to estimate how much of the total variability in costs is explained by each cost driver. This indicates the relative importance of each driver.
- Correlation analysis – Examining the correlation coefficients between drivers and costs indicates the strength of the linear relationship. Drivers with higher correlations have a bigger cost impact.
- Sensitivity analysis – Varying the drivers within a plausible range provides a sensitivity analysis. This shows how costs change in response to changes in the drivers.
- Contribution analysis – This estimates each driver’s proportional contribution to total costs. It sums the products of each driver volume and the driver rate per unit.
Quantifying the cost drivers allows you to focus your efforts on the factors with the biggest impact. The statistical results provide the foundation for building a cost forecasting model.
Develop Cost Driver Model
Building a quantitative cost driver model is key to predicting how costs will change based on different activity levels. Here are the steps to develop an effective cost driver model:
- Identify the major activities that drive costs for the process you are analyzing. Common examples include number of material purchases, machine setups, inspections, shipments, and labor hours.
- Determine how the cost of each activity can be quantified. For labor, this may be the fully loaded hourly rate. For materials, it could be cost per unit purchased.
- Calculate the cost per unit of each cost driver. Divide the total cost of each activity by its volume to derive a cost per unit.
- Multiply the cost per unit by the number of units to estimate the total cost for different activity levels. For example, if a setup costs $200 and there are 25 setups, the total setup cost is 25 * $200 = $5,000.
- Build these factors for each cost driver into a model that allows you to flex the inputs and see the cost impact. Use spreadsheet software to create a user-friendly cost driver model.
- Validate the model by inputting actual volumes and costs from the baseline period and confirming the cost totals match real results. Refine as needed until the model reliably predicts costs.
- Use the model to estimate costs based on projected activity levels. Input potential future volumes and analyze different what-if scenarios.
- Update the model as new data becomes available. Cost driver relationships can change over time so revalidate and recalibrate regularly.
An accurate cost driver model provides a fact-based tool to quantify how costs are impacted by operating decisions and activities. Building one is an essential step to making data-driven decisions to optimize costs.
Implement Changes
Once you’ve identified the key cost drivers and quantified their impact, it’s time to implement changes to reduce costs related to those drivers. Here are some ways to go about this:
- Process improvements: Look for ways to increase efficiency and productivity in your processes. This could involve things like automating manual tasks, streamlining workflows, reducing errors and waste, etc. The goal is to get more output with less input.
- Supplier negotiations: Renegotiate pricing and contracts with suppliers associated with major cost drivers. See if you can get bulk discounts, reduced fees, or improved payment terms.
- Organization changes: Restructure your organization in a way that addresses cost driver issues. For example, centralizing certain functions to achieve economies of scale.
- Product redesign: Change product specifications, components, or packaging to lower production and material costs. Value engineering and redesign can yield significant savings.
- Resource reduction: Scale back usage of expensive resources linked to cost drivers. This may involve things like reducing excess inventory, cutting back on certain raw materials, decreasing equipment runtime, etc.
- Process outsourcing: Consider outsourcing processes tied to major cost drivers to external providers who can do it cheaper. But weigh all pros and cons first.
- Overhead cuts: Look for ways to reduce overhead expenses related to top cost drivers. For instance, facilities, utilities, management labor, etc.
The key is to take targeted actions that focus on the biggest cost drivers first. Continuously track results and tweak your improvement efforts along the way. Cost savings will quickly add up.
Track Results
After making changes based on your cost driver analysis, it’s crucial to track results and measure the impact. Focus on key performance indicators (KPIs) most relevant to the cost drivers you analyzed. Some examples include:
- Total cost per unit
- Cost of goods sold
- Direct material costs
- Direct labor costs
- Manufacturing overhead costs
- Units produced
- Scrap and rework
- Inventory turns
- Capacity utilization
- Customer retention/satisfaction
Carefully monitor these KPIs over time after implementing changes to quantify the impact on costs. Compare to historical benchmarks and target goals. Continuously refine your cost driver model based on measured results. This will allow you to optimize operations, processes, and spending for maximum cost reduction and efficiency.
Sustained tracking provides critical insights for continuous improvement. Cost driver analysis is an iterative process, not a one-time project. Commit to ongoing measurement so you can keep costs under control while adapting to evolving business conditions.
Continuous Improvement
Ongoing improvement is essential for cost driver analysis to remain effective over time. As circumstances change, the variables impacting costs are likely to evolve as well. Companies should have processes in place to continually gather updated data and input this into the cost driver model.
Regularly reviewing the latest data enables identification of when certain cost drivers have become more or less important. This allows refinement of the model to reflect the current situation. Without this ongoing overhaul of the underlying algorithms and weightings, the model risks becoming outdated and inaccurate. Frequent calibration keeps the analysis tuned to the present operational context.
Continuous improvement should involve the following practices:
- Regularly collecting new data on cost drivers. This may be daily, weekly or monthly based on business needs.
- Inputting updated figures into the model. Assess if any cost drivers now have a higher or lower impact.
- Adjusting the model as required based on changes in cost driver impact over time. Certain drivers may increase or decrease in significance.
- Reviewing outcomes to validate that the model still predicts costs accurately. Monitor for any deviations.
- Validating that assumed cost savings from interventions are realized. Track actual savings against projections.
- Identifying new improvement opportunities based on the revised model and data.
- Updating executives and stakeholders with the latest analysis on a frequent basis. Maintain visibility on how cost drivers are evolving.
Continuous improvement ensures cost driver analysis provides maximum value over the long-term. The model remains relevant by keeping pace with changes in the business environment. Regularly reviewing data and refining the algorithms sustains accuracy and optimization. Ongoing enhancement is key for lasting benefits.
Cost Driver Analysis in Supplier Negotiations: Turning Data Into Leverage
In summary, cost driver analysis is an important process for understanding the key factors impacting an organization’s costs. By systematically analyzing cost drivers, companies can gain visibility into what is truly driving spending and make informed decisions about how to reduce costs and operate more efficiently.
The key benefits of effective cost driver analysis include:
- Identifying opportunities for cost reduction and process improvements
- Allowing organizations to focus their efforts on the most impactful cost drivers
- Enabling data-driven decision making about costs rather than relying on assumptions
- Providing ongoing insights through continuous tracking and monitoring of cost drivers
- Supporting strategic planning and budgeting based on predicted impacts of cost drivers
Overall, mastering cost driver analysis helps organizations proactively manage their costs rather than being surprised by unexpected variances. Companies that institutionalize regular analysis and monitoring of cost drivers put themselves in a strong position to control spending, maximize efficiency, and drive profitability over the long-term.
One of the most actionable applications of cost driver analysis is in supplier negotiations. When procurement teams can show a supplier exactly which cost drivers are out of line — an unnecessarily tight tolerance adding 15% to machining time, for example, or a material grade that's over-specified for the application — the conversation shifts from price-haggling to problem-solving. Suppliers are often willing to work collaboratively on cost reduction when the analysis is specific and data-backed.
For manufactured components, engineering drawings are a critical but underused input in cost driver analysis. Drawings contain the tolerance requirements, material specifications, surface finish designations, and geometric complexity that drive manufacturing cost — data that's rarely captured in ERP systems. Organizations that connect drawing data to purchasing records gain a significant advantage: they can correlate design decisions directly with cost outcomes, and flag over-engineered specifications before they become a negotiation blind spot.
One of the solutions that cover the general use cases is CADDi Drawer, which:
- Extracts information from drawings, which are image files, i.e., unstructured data that need to be handled and viewed by people, and converts it into structured data.
- Associates various information such as purchasing data, supplier data, quality and manufacturing-related documents with drawings, elevating information that is difficult to utilize when scattered into valuable data assets.
- Enables quick searching, grouping, listing, outputting, and further adding information to the accumulated data assets from various perspectives.
It may seem simple, but until now, there was no mechanism to achieve this. Considering the enormous amount of time procurement professionals have spent gathering, analyzing, and making judgments based on this data, one can imagine the magnitude of the impact.
These features provide powerful support for procurement professionals in the five use cases. Particularly powerful is the high-precision similarity search function. Unlike common image-based similarity judgments based solely on appearance, it recognizes the shapes of products and parts depicted in drawings before making similarity judgments, enabling it to find similar drawings that other software cannot extract.
This significantly streamlines the basic actions of cost driver analysis, such as grouping parts, gathering highly relevant past data, and constructing data-driven logic for analysis and negotiation.
Ready to see CADDi Drawer in action? Get a personalized demo.
Subscribe to our Blog!
.svg)
.svg)
.svg)

Related Resources