.svg)

Data-Driven Sourcing: Extracting Key Insights to Build a Supplier Portfolio

Table of Contents

Introduction
Data insights are key to making informed, strategic decisions in any sourcing process. By collecting and analyzing relevant data points, organizations can identify areas for improvement, cost savings opportunities, supplier performance issues, and much more.
With data-driven insights, sourcing teams can approach negotiations armed with leverage based on historical pricing trends, total cost of ownership models, and benchmarking against other suppliers or industry standards. Data also enables sourcing professionals to take a proactive approach instead of reacting to issues as they arise.
Overall, data insights empower organizations to enhance relationships with suppliers, reduce maverick spending, implement performance metrics, and align procurement activities with larger business goals. In today’s digital world, data analytics should be an integral part of any organization’s sourcing strategy.
Sourcing Data Points to Analyze
When looking to draw insights from data to improve sourcing, there are several key data points to analyze:
- Lead Time: Track and analyze lead times from different suppliers. Look at average lead times as well as variability. Suppliers with lower and more consistent lead times can help reduce inventory costs.
- Supplier Quality: Analyze quality metrics like defect rates for different suppliers. Poor quality leads to waste and rework costs. Identify suppliers with the highest quality ratings.
- Costs: Compare pricing, total landed costs, and total cost of ownership for different suppliers. This helps identify cost savings opportunities.
- Inventory Levels: Track inventory levels by part number and analyze trends. High inventories tie up working capital. Identify parts with excess stock and source judiciously.
- Forecasts: Review demand forecasts at the part number level. Analyze forecast accuracy by supplier. Forecast error leads to inefficient supply plans.
- Supplier Risks: Assess supplier risks like production capacity, business continuity plans, and financial health. Diversify sourcing for high-risk parts to reduce supply disruptions.
Analyzing Supplier Performance Data
Analyzing supplier performance data is critical for making informed sourcing decisions. Here are some key metrics to analyze:
Quality
- Defect rates – Monitor the percentage of defective or non-conforming parts received from each supplier. A high defect rate may indicate issues with quality control.
- Customer rejects – Track instances where customers reject parts due to quality issues. Trace rejects back to the responsible supplier.
- Supplier quality audits – Regularly audit supplier facilities and processes. Document quality control capabilities.
Costs
- Pricing data – Maintain up-to-date supplier pricing for benchmarking and negotiation leverage. Watch for price increases.
- Total cost analysis – Consider all costs like logistics and quality in the total cost equation, rather than just unit price.
- Cost reduction performance – Track supplier efforts and success at reducing costs. Incentivize further cost optimization.
Delivery
- On-time delivery – Calculate the percentage of on-time deliveries for each supplier. Delays can impact production schedules.
- Lead time – Measure and optimize the time from order to delivery. Excessive lead times can increase costs.
- Supply chain disruptions – Monitor supply chain continuity for risks of shortages or delays. Identify backup sources as needed.
Responsiveness
- Quote turnaround time – Track how quickly suppliers provide quotes after RFQs to gauge responsiveness.
- Communication – Evaluate how promptly suppliers respond to inquiries and requests. Lack of responsiveness can hinder collaboration.
- Customization ability – Assess each supplier’s ability to provide customized service, parts, or solutions. Responsiveness to unique needs provides value.
Identifying Sourcing Gaps and Opportunities
The data collected and analyzed during the sourcing process provides key insights into gaps and opportunities for improvement. Some areas to analyze include:
Demand/Supply Mismatches
- Are there instances where demand exceeds supply or vice versa? This indicates a mismatch that needs to be addressed.
- Analyze trends over time. Is the mismatch increasing or temporary? This provides context for determining the right actions.
- Break down mismatches by product/service, geographic region, time period, etc. The more granular the analysis, the better sourcing can respond.
Price Fluctuations
- Look at pricing trends across suppliers and categories. Are there unusual spikes or dips?
- Compare pricing for the same materials/services across suppliers. Significant differences may indicate opportunities for cost savings.
- Monitor changes in commodity or input prices that drive supplier costs. This allows anticipation of future price impacts.
Supplier Consolidation
- Assess market share and acquisition trends among key suppliers. Is significant consolidation occurring?
- Determine potential impacts of reduced competition among suppliers, such as decreased incentive for competitive pricing.
- Identify alternative or emerging suppliers to mitigate risk of reliance on one dominant player.
Thorough analysis of sourcing data reveals unseen patterns, trends, and opportunities for improvement. By dedicating resources to identifying gaps and issues, organizations can pursue data-driven actions that optimize costs, supply chain continuity, and procurement results.
Turning Insights into Action
Once data insights have been drawn from analyzing supplier performance, sourcing professionals can take action to optimize supply chains. There are several ways to leverage the insights:
Renegotiating Contracts
If the data shows suppliers are underperforming on pricing, quality, or delivery times, this evidence can be used during contract negotiations to push for improved terms. Armed with performance metrics, buyers have more leverage in price and SLA discussions.
Dual Sourcing
Analyzing supplier data may reveal over-reliance on a single supplier and exposure risks. Dual-sourcing or multi-sourcing can mitigate risks and promote competition. Adding a second or third qualified supplier can motivate incumbents to sharpen their game.
Expanding Supplier Base
The 80/20 rule often applies in supply chains – 80% of spend is with 20% of suppliers. The data may show opportunities to diversify the supplier base, reduce costs, and improve supply security by sourcing from new vendors. But careful vetting is required.
Supplier Development
Using performance data, buyers can work collaboratively with existing suppliers on targeted improvement initiatives. This could involve investments in supplier capabilities and technologies to boost quality, lower defects, and improve on-time delivery. The goal is a win-win relationship.
How CADDi Drawer enhance data-driven sourcing
In manufacturing, optimizing the sourcing process is crucial for reducing costs, improving efficiency, and gaining visibility into spending. That’s where CADDi Drawer comes in.
The intelligent search and analysis enabled by CADDi Drawer empowers manufacturers to enhance data-driven sourcing processes:
- Supplier Selection & Negotiation – Easily identify the best suppliers based on historical data. Similar parts data paired with cost info exposes price inconsistencies for focused negotiation.
- Supplier Consolidation – Pinpoint similar drawings sourced from multiple suppliers. Consolidate volumes to strategic suppliers to leverage economies of scale.
- Value Analysis & Value Engineering (VAVE) – Flag similar parts with significant price differences. Analyze design differences driving cost variation to guide value engineering.
CADDi Drawer leverages AI and patented technology to help manufacturers capitalize on past drawings and quotations, elevate revenue, and cut procurement costs. Here’s how its key features enable a more strategic and efficient sourcing process:
Digitizing Drawings
CADDi Drawer automatically scans and extracts data from PDF drawings, including handwritten ones. This digitization makes the entire drawings archive, even those from 30+ years ago, fully searchable and comparable. Connecting quotations, cost breakdowns, supplier info and other supply chain data to the drawings provides procurement teams with a comprehensive view of each part.
Intelligent Search
With CADDi Drawer’s advanced search capabilities, users can instantly find relevant drawings based on any criteria. Keyword search allows looking up drawings by material, size, designer name, part name, notes and more. The patented Similarity Search identifies similar parts across the archive based on shape, enabling quick identification of related drawings. Image Search takes it a step further – simply upload a photo of a sketch or drawing and find the closest matches.
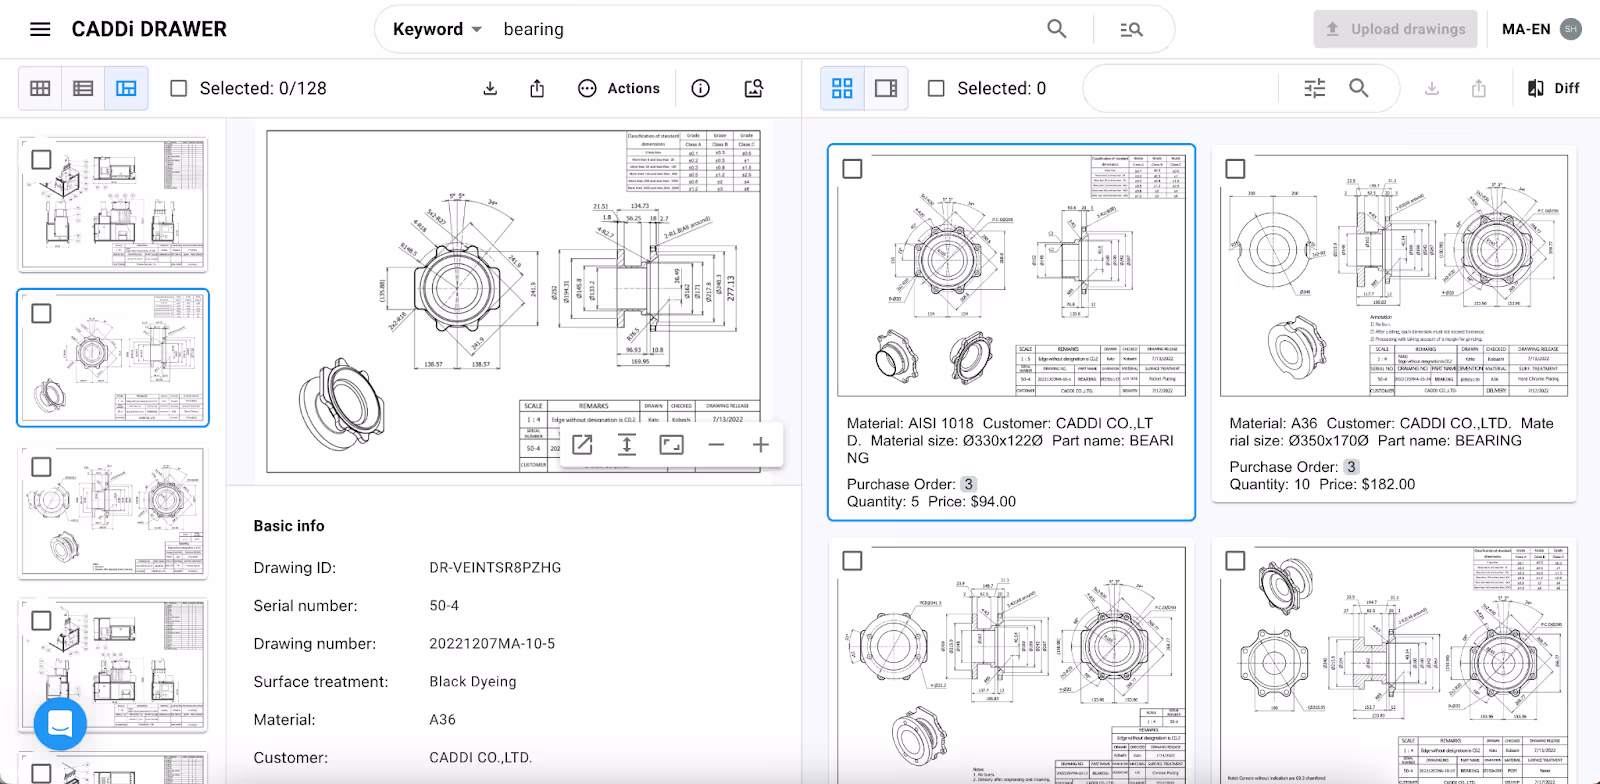
Streamlining Analysis
CADDi Drawer’s Difference Identification feature allows users to quickly spot the differences between two similar drawings or revisions. In one click, all drawing data along with associated supplier info, pricing, tags, etc. can be exported to Excel for further analysis. This automation of tedious manual comparison accelerates decision-making.
By digitizing and connecting drawing data, CADDi Drawer provides manufacturing procurement teams with the insights needed to make more strategic sourcing decisions. Leveraging historical data to optimize supplier relationships, consolidate spend, and re-engineer parts for cost reduction enables manufacturers to elevate revenues and boost profitability.
Introduction
Data insights are key to making informed, strategic decisions in any sourcing process. By collecting and analyzing relevant data points, organizations can identify areas for improvement, cost savings opportunities, supplier performance issues, and much more.
With data-driven insights, sourcing teams can approach negotiations armed with leverage based on historical pricing trends, total cost of ownership models, and benchmarking against other suppliers or industry standards. Data also enables sourcing professionals to take a proactive approach instead of reacting to issues as they arise.
Overall, data insights empower organizations to enhance relationships with suppliers, reduce maverick spending, implement performance metrics, and align procurement activities with larger business goals. In today’s digital world, data analytics should be an integral part of any organization’s sourcing strategy.
Sourcing Data Points to Analyze
When looking to draw insights from data to improve sourcing, there are several key data points to analyze:
- Lead Time: Track and analyze lead times from different suppliers. Look at average lead times as well as variability. Suppliers with lower and more consistent lead times can help reduce inventory costs.
- Supplier Quality: Analyze quality metrics like defect rates for different suppliers. Poor quality leads to waste and rework costs. Identify suppliers with the highest quality ratings.
- Costs: Compare pricing, total landed costs, and total cost of ownership for different suppliers. This helps identify cost savings opportunities.
- Inventory Levels: Track inventory levels by part number and analyze trends. High inventories tie up working capital. Identify parts with excess stock and source judiciously.
- Forecasts: Review demand forecasts at the part number level. Analyze forecast accuracy by supplier. Forecast error leads to inefficient supply plans.
- Supplier Risks: Assess supplier risks like production capacity, business continuity plans, and financial health. Diversify sourcing for high-risk parts to reduce supply disruptions.
Analyzing Supplier Performance Data
Analyzing supplier performance data is critical for making informed sourcing decisions. Here are some key metrics to analyze:
Quality
- Defect rates – Monitor the percentage of defective or non-conforming parts received from each supplier. A high defect rate may indicate issues with quality control.
- Customer rejects – Track instances where customers reject parts due to quality issues. Trace rejects back to the responsible supplier.
- Supplier quality audits – Regularly audit supplier facilities and processes. Document quality control capabilities.
Costs
- Pricing data – Maintain up-to-date supplier pricing for benchmarking and negotiation leverage. Watch for price increases.
- Total cost analysis – Consider all costs like logistics and quality in the total cost equation, rather than just unit price.
- Cost reduction performance – Track supplier efforts and success at reducing costs. Incentivize further cost optimization.
Delivery
- On-time delivery – Calculate the percentage of on-time deliveries for each supplier. Delays can impact production schedules.
- Lead time – Measure and optimize the time from order to delivery. Excessive lead times can increase costs.
- Supply chain disruptions – Monitor supply chain continuity for risks of shortages or delays. Identify backup sources as needed.
Responsiveness
- Quote turnaround time – Track how quickly suppliers provide quotes after RFQs to gauge responsiveness.
- Communication – Evaluate how promptly suppliers respond to inquiries and requests. Lack of responsiveness can hinder collaboration.
- Customization ability – Assess each supplier’s ability to provide customized service, parts, or solutions. Responsiveness to unique needs provides value.
Identifying Sourcing Gaps and Opportunities
The data collected and analyzed during the sourcing process provides key insights into gaps and opportunities for improvement. Some areas to analyze include:
Demand/Supply Mismatches
- Are there instances where demand exceeds supply or vice versa? This indicates a mismatch that needs to be addressed.
- Analyze trends over time. Is the mismatch increasing or temporary? This provides context for determining the right actions.
- Break down mismatches by product/service, geographic region, time period, etc. The more granular the analysis, the better sourcing can respond.
Price Fluctuations
- Look at pricing trends across suppliers and categories. Are there unusual spikes or dips?
- Compare pricing for the same materials/services across suppliers. Significant differences may indicate opportunities for cost savings.
- Monitor changes in commodity or input prices that drive supplier costs. This allows anticipation of future price impacts.
Supplier Consolidation
- Assess market share and acquisition trends among key suppliers. Is significant consolidation occurring?
- Determine potential impacts of reduced competition among suppliers, such as decreased incentive for competitive pricing.
- Identify alternative or emerging suppliers to mitigate risk of reliance on one dominant player.
Thorough analysis of sourcing data reveals unseen patterns, trends, and opportunities for improvement. By dedicating resources to identifying gaps and issues, organizations can pursue data-driven actions that optimize costs, supply chain continuity, and procurement results.
Turning Insights into Action
Once data insights have been drawn from analyzing supplier performance, sourcing professionals can take action to optimize supply chains. There are several ways to leverage the insights:
Renegotiating Contracts
If the data shows suppliers are underperforming on pricing, quality, or delivery times, this evidence can be used during contract negotiations to push for improved terms. Armed with performance metrics, buyers have more leverage in price and SLA discussions.
Dual Sourcing
Analyzing supplier data may reveal over-reliance on a single supplier and exposure risks. Dual-sourcing or multi-sourcing can mitigate risks and promote competition. Adding a second or third qualified supplier can motivate incumbents to sharpen their game.
Expanding Supplier Base
The 80/20 rule often applies in supply chains – 80% of spend is with 20% of suppliers. The data may show opportunities to diversify the supplier base, reduce costs, and improve supply security by sourcing from new vendors. But careful vetting is required.
Supplier Development
Using performance data, buyers can work collaboratively with existing suppliers on targeted improvement initiatives. This could involve investments in supplier capabilities and technologies to boost quality, lower defects, and improve on-time delivery. The goal is a win-win relationship.
How CADDi Drawer enhance data-driven sourcing
In manufacturing, optimizing the sourcing process is crucial for reducing costs, improving efficiency, and gaining visibility into spending. That’s where CADDi Drawer comes in.
The intelligent search and analysis enabled by CADDi Drawer empowers manufacturers to enhance data-driven sourcing processes:
- Supplier Selection & Negotiation – Easily identify the best suppliers based on historical data. Similar parts data paired with cost info exposes price inconsistencies for focused negotiation.
- Supplier Consolidation – Pinpoint similar drawings sourced from multiple suppliers. Consolidate volumes to strategic suppliers to leverage economies of scale.
- Value Analysis & Value Engineering (VAVE) – Flag similar parts with significant price differences. Analyze design differences driving cost variation to guide value engineering.
CADDi Drawer leverages AI and patented technology to help manufacturers capitalize on past drawings and quotations, elevate revenue, and cut procurement costs. Here’s how its key features enable a more strategic and efficient sourcing process:
Digitizing Drawings
CADDi Drawer automatically scans and extracts data from PDF drawings, including handwritten ones. This digitization makes the entire drawings archive, even those from 30+ years ago, fully searchable and comparable. Connecting quotations, cost breakdowns, supplier info and other supply chain data to the drawings provides procurement teams with a comprehensive view of each part.
Intelligent Search
With CADDi Drawer’s advanced search capabilities, users can instantly find relevant drawings based on any criteria. Keyword search allows looking up drawings by material, size, designer name, part name, notes and more. The patented Similarity Search identifies similar parts across the archive based on shape, enabling quick identification of related drawings. Image Search takes it a step further – simply upload a photo of a sketch or drawing and find the closest matches.
Streamlining Analysis
CADDi Drawer’s Difference Identification feature allows users to quickly spot the differences between two similar drawings or revisions. In one click, all drawing data along with associated supplier info, pricing, tags, etc. can be exported to Excel for further analysis. This automation of tedious manual comparison accelerates decision-making.
By digitizing and connecting drawing data, CADDi Drawer provides manufacturing procurement teams with the insights needed to make more strategic sourcing decisions. Leveraging historical data to optimize supplier relationships, consolidate spend, and re-engineer parts for cost reduction enables manufacturers to elevate revenues and boost profitability.
Ready to see CADDi Drawer in action? Get a personalized demo.
Subscribe to our Blog!
.svg)
.svg)
.svg)

Related Resources