.svg)

Procurement 101: XYZ Analysis – How it works and why it’s important

Table of Contents

Ever felt like ABC analysis was the only game in town for getting your inventory and customer segments in line? Think again! The business world is brimming with strategies that might just outshine ABC analysis in certain scenarios. Whether you’re aiming to forecast demand like a fortune-teller, manage your inventory like a top-tier chess player, or segment your customers with the precision of a tailor, we’ve got you covered with some top-notch alternatives.
- XYZ Analysis: A method that classifies products or items based on the predictability of demand. It is useful in inventory management and demand forecasting.
- Fast, Slow, Non-moving Analysis (FSN Analysis): A method that classifies inventory items based on the speed of their movement. It is useful for inventory management and purchasing strategies.
- Cluster Analysis: A statistical method that groups items based on similarity. It is used for market segmentation and product portfolio analysis.
- RFM Analysis: A method that segments based on customer behavior. It is useful for customer loyalty and marketing strategies.
In this article, let’s unravel the mysteries of XYZ Analysis together, and discover how it can transform your approach to inventory management and demand forecasting.
Understanding XYZ Analysis
XYZ analysis categorizes inventory items based on the predictability of their demand. This method slices through the chaos of stock levels to classify items into three distinct categories:
- X Items: The stalwarts of stability, X items boast very little demand variation. Their predictability is a procurement manager’s dream, making demand forecasting almost as straightforward as reading a book with large, bold letters.
- Y Items: These items are the adventurers, with demand as fluctuating as the tides. Seasonality, economic factors, and market trends are their playfields, demanding a keen eye to predict their next move.
- Z Items: The wildcards of the inventory, Z items exhibit high demand variability, making their forecasting a challenging, if not thrilling, endeavor. Their unpredictability can often lead to stockouts or excess inventory, turning inventory management into a high-stakes game.
This classification not only simplifies inventory management but also significantly enhances decision-making processes. By understanding the demand variability of items, procurement managers can tailor their strategies for ordering, stocking, and managing inventory, ensuring optimal levels are maintained without tying up too much working capital.
The Significance of XYZ Analysis in Manufacturing and Procurement
The magic of XYZ analysis lies in its ability to transform inventory management from a guessing game into a strategic operation. Its benefits are manifold:
- Optimized Inventory Levels: By classifying items based on demand variability, procurement managers can maintain just the right amount of stock, avoiding the pitfalls of over or understocking.
- Enhanced Forecasting Accuracy: With a clear view of which items have predictable demand and which do not, forecasting becomes more accurate, leading to more efficient procurement schedules.
- Reduced Inventory Obsolescence: The precise classification of items ensures that products less likely to be sold are not overstocked, minimizing the risk of obsolescence.
In essence, XYZ analysis serves as the linchpin in the machinery of manufacturing and procurement. It ensures that resources are allocated efficiently, that production lines run smoothly without the hiccup of unexpected stockouts, and that customer satisfaction remains high due to the steady availability of products. This analysis not only streamlines operations but also fortifies the foundation of supply chain management, making it resilient against the unpredictabilities of the market.
Methodology and Implementation
Embarking on the journey of XYZ analysis begins with a meticulous examination of your inventory. Here’s a roadmap to navigate through the process:
- Collect Historical Demand Data: The first step is gathering data on the consumption rate, usage quantity, or sales volume of each item over a specific period.
- Classify According to Demand Variability: Use this data to categorize items into X, Y, and Z groups based on their demand predictability and variability.
- Implement Tailored Strategies: Design inventory management strategies specific to each category, focusing on replenishment frequencies, safety stock levels, and forecasting methods.
Integration with Inventory Management Systems is crucial for automating monitoring and decision-making processes, ensuring real-time updates and dynamic responses to market changes.
Combining XYZ with ABC Analysis
For a more granular control over inventory, blending XYZ analysis with ABC analysis elevates inventory management to a strategic cornerstone of business operations. This dual approach segments items into nine categories, offering a multidimensional view of your inventory based on both demand variability and financial impact.
.avif)
Case Study: A Manufacturing Giant’s Success Story
Consider the case of a leading electronics manufacturer who implemented XYZ analysis in conjunction with ABC analysis. By doing so, they achieved a 20% reduction in inventory costs and a 15% improvement in order fulfillment rates within the first year. This dual analysis enabled them to prioritize their procurement and production strategies, focusing on high-value items with stable demand (X-A items) for just-in-time procurement and managing more volatile items (Z-C items) with a more cautious approach to minimize holding costs.
Challenges and Considerations
Despite its benefits, XYZ analysis is not without its challenges:
- Rapid Demand Shifts: Markets are fickle, and sudden changes can shift items between categories, necessitating agile responses.
- Comprehensive Data Collection: A robust dataset, covering various market conditions, is crucial for accurate classification.
Regular reassessment and a dynamic approach are paramount to keeping the analysis relevant and effective.
How CADDi Drawer Can Help
CADDi Drawer, a cutting-edge digital platform designed for the manufacturing and procurement sectors, directly addresses the pressing challenges in data management within XYZ analysis. Its capabilities can provide an innovative solution to many of the hurdles discussed earlier, particularly those related to data inconsistency, fragmentation, and the lack of a centralized system for data sharing and analysis.
Streamline activities in the procurement process
The following features enable you to streamline the time-consuming tasks of data collection and organization in procurement operations.
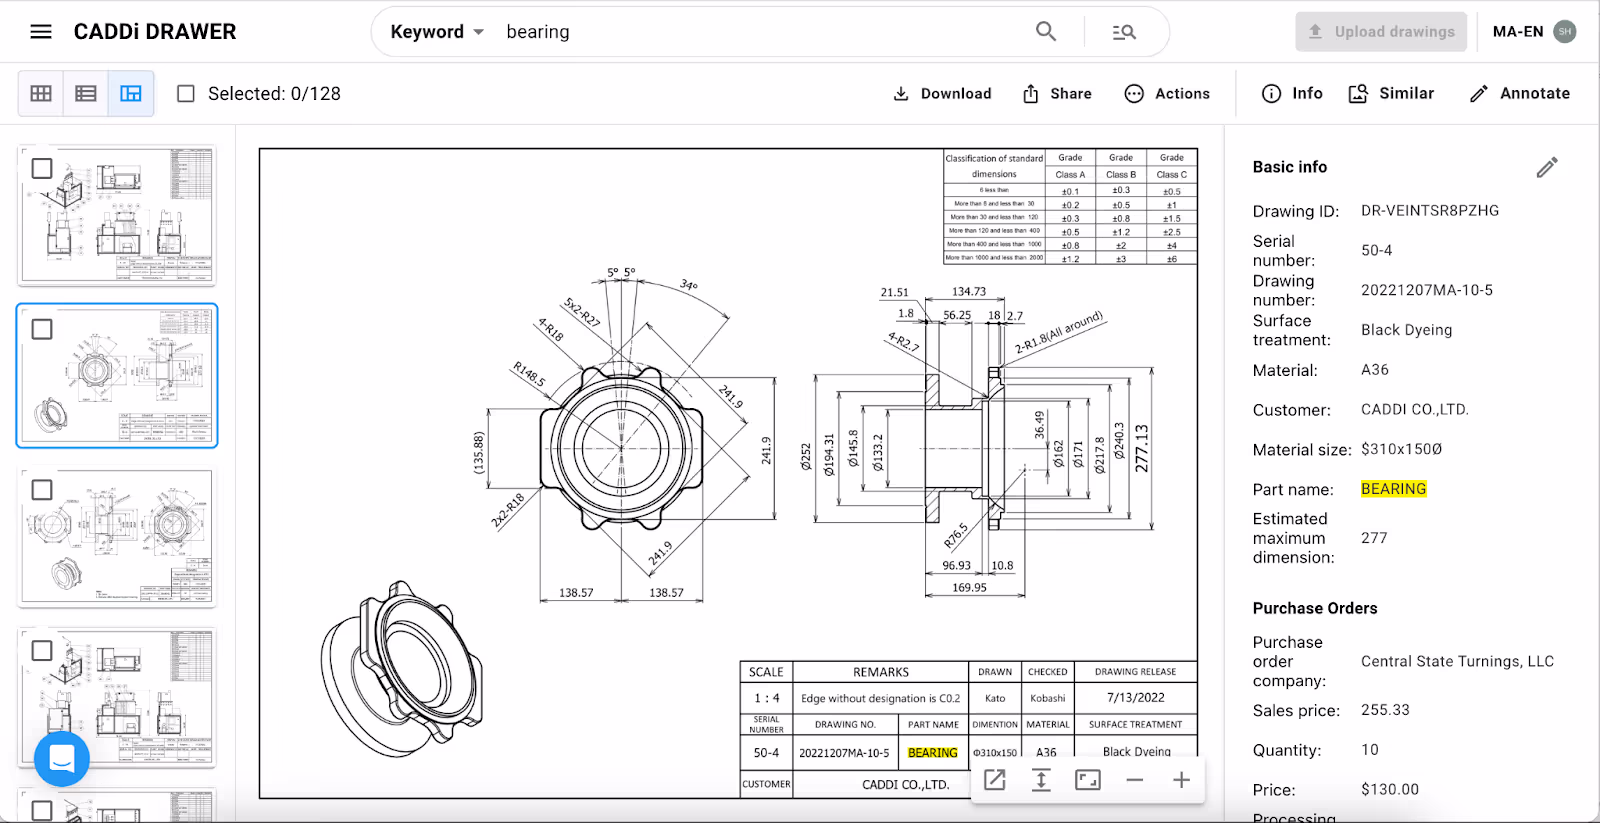
- Price data and supplier information can be automatically linked to each drawing and can also be exported together.
- By using keyword searches combined with similarity searches, the time spent searching for drawings and data in procurement tasks can be reduced.
Enhancing Collaboration and Standardization
Collaboration and standardization across the supply chain are crucial for overcoming visibility challenges. CADDi Drawer fosters collaboration by enabling easy sharing and access to data among all supply chain participants. This collaborative environment ensures that everyone is on the same page, enhancing coordination and efficiency. Additionally, the platform supports data standardization, which is vital for integrating data from diverse sources and ensuring that it is comparable and actionable.
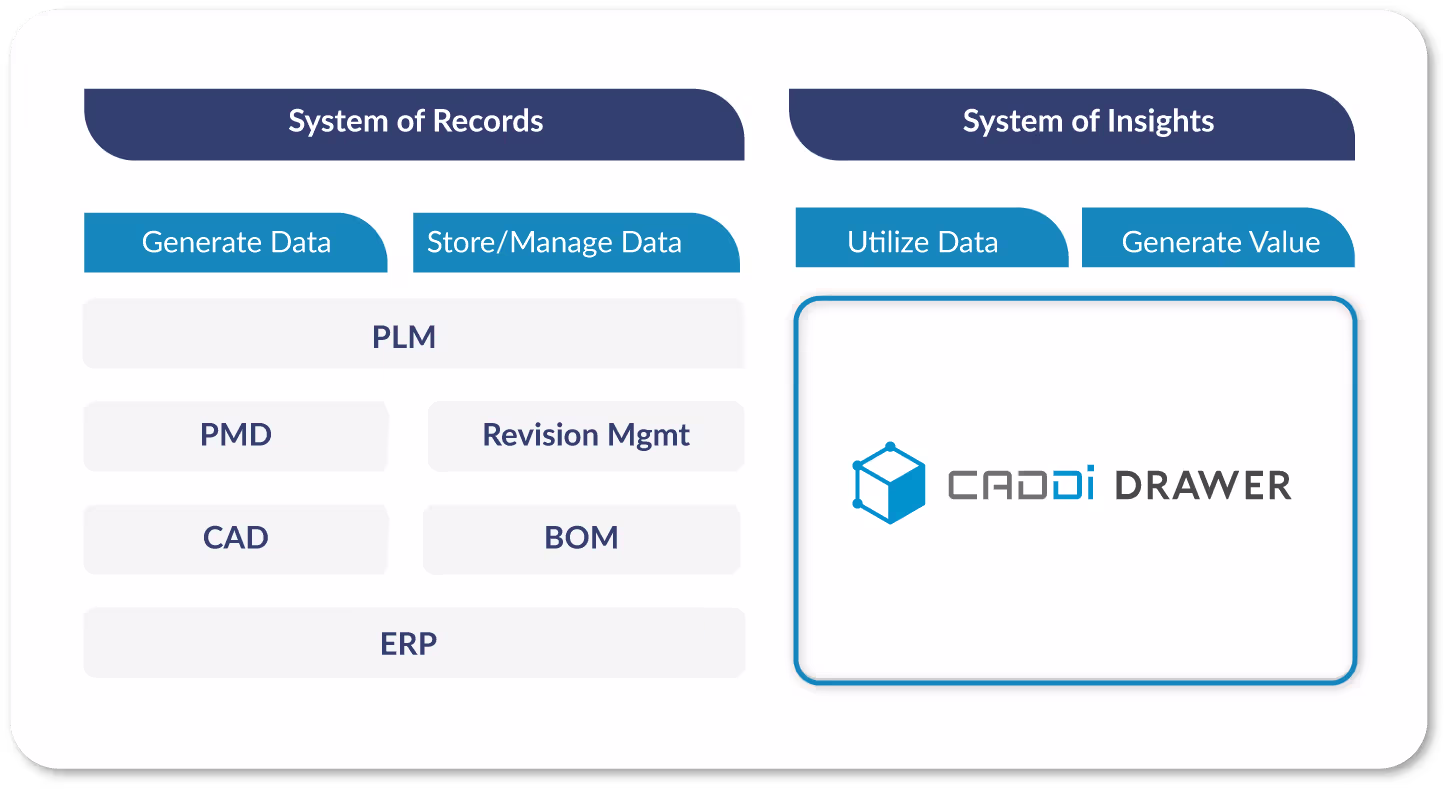
CADDi Drawer serves as a System of Insights (SoI), designed to leverage data primarily managed and stored by Systems of Records (SoR), like those represented by ERPs. Utilizing data stored in SoRs and data extracted and structured from drawings by CADDi Drawer, it supports procurement intelligence processes, including analyses and data processing for supplier selection and management, RFQ creation, and quote evaluations.
Ever felt like ABC analysis was the only game in town for getting your inventory and customer segments in line? Think again! The business world is brimming with strategies that might just outshine ABC analysis in certain scenarios. Whether you’re aiming to forecast demand like a fortune-teller, manage your inventory like a top-tier chess player, or segment your customers with the precision of a tailor, we’ve got you covered with some top-notch alternatives.
- XYZ Analysis: A method that classifies products or items based on the predictability of demand. It is useful in inventory management and demand forecasting.
- Fast, Slow, Non-moving Analysis (FSN Analysis): A method that classifies inventory items based on the speed of their movement. It is useful for inventory management and purchasing strategies.
- Cluster Analysis: A statistical method that groups items based on similarity. It is used for market segmentation and product portfolio analysis.
- RFM Analysis: A method that segments based on customer behavior. It is useful for customer loyalty and marketing strategies.
In this article, let’s unravel the mysteries of XYZ Analysis together, and discover how it can transform your approach to inventory management and demand forecasting.
Understanding XYZ Analysis
XYZ analysis categorizes inventory items based on the predictability of their demand. This method slices through the chaos of stock levels to classify items into three distinct categories:
- X Items: The stalwarts of stability, X items boast very little demand variation. Their predictability is a procurement manager’s dream, making demand forecasting almost as straightforward as reading a book with large, bold letters.
- Y Items: These items are the adventurers, with demand as fluctuating as the tides. Seasonality, economic factors, and market trends are their playfields, demanding a keen eye to predict their next move.
- Z Items: The wildcards of the inventory, Z items exhibit high demand variability, making their forecasting a challenging, if not thrilling, endeavor. Their unpredictability can often lead to stockouts or excess inventory, turning inventory management into a high-stakes game.
This classification not only simplifies inventory management but also significantly enhances decision-making processes. By understanding the demand variability of items, procurement managers can tailor their strategies for ordering, stocking, and managing inventory, ensuring optimal levels are maintained without tying up too much working capital.
The Significance of XYZ Analysis in Manufacturing and Procurement
The magic of XYZ analysis lies in its ability to transform inventory management from a guessing game into a strategic operation. Its benefits are manifold:
- Optimized Inventory Levels: By classifying items based on demand variability, procurement managers can maintain just the right amount of stock, avoiding the pitfalls of over or understocking.
- Enhanced Forecasting Accuracy: With a clear view of which items have predictable demand and which do not, forecasting becomes more accurate, leading to more efficient procurement schedules.
- Reduced Inventory Obsolescence: The precise classification of items ensures that products less likely to be sold are not overstocked, minimizing the risk of obsolescence.
In essence, XYZ analysis serves as the linchpin in the machinery of manufacturing and procurement. It ensures that resources are allocated efficiently, that production lines run smoothly without the hiccup of unexpected stockouts, and that customer satisfaction remains high due to the steady availability of products. This analysis not only streamlines operations but also fortifies the foundation of supply chain management, making it resilient against the unpredictabilities of the market.
Methodology and Implementation
Embarking on the journey of XYZ analysis begins with a meticulous examination of your inventory. Here’s a roadmap to navigate through the process:
- Collect Historical Demand Data: The first step is gathering data on the consumption rate, usage quantity, or sales volume of each item over a specific period.
- Classify According to Demand Variability: Use this data to categorize items into X, Y, and Z groups based on their demand predictability and variability.
- Implement Tailored Strategies: Design inventory management strategies specific to each category, focusing on replenishment frequencies, safety stock levels, and forecasting methods.
Integration with Inventory Management Systems is crucial for automating monitoring and decision-making processes, ensuring real-time updates and dynamic responses to market changes.
Combining XYZ with ABC Analysis
For a more granular control over inventory, blending XYZ analysis with ABC analysis elevates inventory management to a strategic cornerstone of business operations. This dual approach segments items into nine categories, offering a multidimensional view of your inventory based on both demand variability and financial impact.
Case Study: A Manufacturing Giant’s Success Story
Consider the case of a leading electronics manufacturer who implemented XYZ analysis in conjunction with ABC analysis. By doing so, they achieved a 20% reduction in inventory costs and a 15% improvement in order fulfillment rates within the first year. This dual analysis enabled them to prioritize their procurement and production strategies, focusing on high-value items with stable demand (X-A items) for just-in-time procurement and managing more volatile items (Z-C items) with a more cautious approach to minimize holding costs.
Challenges and Considerations
Despite its benefits, XYZ analysis is not without its challenges:
- Rapid Demand Shifts: Markets are fickle, and sudden changes can shift items between categories, necessitating agile responses.
- Comprehensive Data Collection: A robust dataset, covering various market conditions, is crucial for accurate classification.
Regular reassessment and a dynamic approach are paramount to keeping the analysis relevant and effective.
How CADDi Drawer Can Help
CADDi Drawer, a cutting-edge digital platform designed for the manufacturing and procurement sectors, directly addresses the pressing challenges in data management within XYZ analysis. Its capabilities can provide an innovative solution to many of the hurdles discussed earlier, particularly those related to data inconsistency, fragmentation, and the lack of a centralized system for data sharing and analysis.
Streamline activities in the procurement process
The following features enable you to streamline the time-consuming tasks of data collection and organization in procurement operations.
- Price data and supplier information can be automatically linked to each drawing and can also be exported together.
- By using keyword searches combined with similarity searches, the time spent searching for drawings and data in procurement tasks can be reduced.
Enhancing Collaboration and Standardization
Collaboration and standardization across the supply chain are crucial for overcoming visibility challenges. CADDi Drawer fosters collaboration by enabling easy sharing and access to data among all supply chain participants. This collaborative environment ensures that everyone is on the same page, enhancing coordination and efficiency. Additionally, the platform supports data standardization, which is vital for integrating data from diverse sources and ensuring that it is comparable and actionable.
CADDi Drawer serves as a System of Insights (SoI), designed to leverage data primarily managed and stored by Systems of Records (SoR), like those represented by ERPs. Utilizing data stored in SoRs and data extracted and structured from drawings by CADDi Drawer, it supports procurement intelligence processes, including analyses and data processing for supplier selection and management, RFQ creation, and quote evaluations.
Ready to see CADDi Drawer in action? Get a personalized demo.
Subscribe to our Blog!
.svg)
.svg)
.svg)

Related Resources