.svg)

How to Leverage Engineering Drawing Data for VAVE Initiatives
Table of Contents

Introduction
Value Analysis / Value Engineering (VAVE) initiatives aim to optimize the value of products, projects, or services. Analyzing data from technical drawings is becoming increasingly important for successful VAVE implementation.
Technical drawings contain a wealth of information about a product’s materials, dimensions, assembly, and manufacturing processes. With the rise of digital drawings and 3D models, even more data can be extracted. Leveraging this data enables fact-based decision making to reduce costs, improve quality, and maximize value.
For example, drawing data can reveal material usage rates for cost reduction opportunities. It can also show potential failure points or manufacturing difficulties. Applying data insights proactively during VAVE prevents issues down the line. Overall, drawing analytics provide tangible evidence to guide impactful changes while preserving functionality.
As data utilization expands across industries, integrating drawing analytics into VAVE provides a competitive advantage. Companies that leverage this data will make smarter value improvements and outperform peers. The future success of VAVE relies on capitalizing on these rich data sources.
Practices to Utilize Engineering Drawing Data in VAVE
1. Material Usage Analysis
One key practice is analyzing material usage from engineering drawings. By extracting material specifications and dimensions, VAVE teams can calculate the precise quantities of materials used in a product. This enables identifying opportunities to:
- Reduce material usage without compromising functionality
- Substitute cheaper materials with similar properties
- Optimize material allocation across components
- Negotiate better prices through bulk purchasing
For example, a vehicle manufacturer used drawing data to identify that they could reduce the thickness of a car door panel by 10% while maintaining structural integrity. This simple change saved millions in annual material costs.
2. Tolerance Analysis
Another valuable practice is tolerance analysis. Engineering drawings specify the acceptable range of variation for each dimension. Tight tolerances require more precise manufacturing, which increases costs. VAVE teams can use tolerance data to:
- Identify unnecessarily tight tolerances
- Determine the impact of loosening tolerances on functionality
- Optimize tolerances for critical vs. non-critical components
- Reduce manufacturing costs through looser tolerances
For instance, a machinery manufacturer analyzed tolerances across their product line. They found that 80% of components had tighter tolerances than necessary. By selectively loosening tolerances, they reduced manufacturing costs by 15% without affecting quality.
3. Assembly Optimization
Engineering drawings also provide crucial data about product assembly. VAVE teams can use this information to streamline assembly processes and reduce costs. Key opportunities include:
- Minimizing the number of components
- Simplifying component designs for easier assembly
- Optimizing the assembly sequence
- Identifying opportunities for automation
One electronics company used drawing data to analyze their circuit board assembly process. They identified components that could be consolidated and redesigned the board layout for robotic assembly. These changes cut assembly time by 30% and reduced defects.
4. Failure Mode Analysis
Drawing data can also help predict and prevent potential failure modes. By analyzing how components interact and identifying high-stress areas, VAVE teams can proactively address issues. This involves:
- Conducting finite element analysis (FEA) to simulate stresses
- Identifying potential failure points from drawing geometry
- Redesigning components to distribute stresses evenly
- Specifying more durable materials in high-wear areas
A medical device company used FEA on their product drawings to identify a potential failure point in a critical valve component. They redesigned the valve housing and specified a stronger material. These changes prevented costly recalls and lawsuits.
5. Manufacturing Process Optimization
Finally, engineering drawings contain valuable data for optimizing manufacturing processes. VAVE teams can use this information to:
- Identify components suitable for different manufacturing methods
- Optimize designs for manufacturability
- Reduce setup times and changeovers
- Minimize scrap and rework
For example, a furniture manufacturer analyzed their product drawings and identified components that could be produced using CNC machining instead of manual woodworking. They redesigned these components and invested in CNC equipment. This change reduced manufacturing time by 50% and improved quality consistency.
Case Study: Aerospace Manufacturer
To illustrate the power of leveraging engineering drawing data for VAVE, consider the case of a leading aerospace manufacturer. The company was facing intense pressure to reduce costs while maintaining strict quality and safety standards.
The VAVE team decided to focus on analyzing engineering drawings for a key component: the landing gear assembly. By extracting material specifications, dimensions, and tolerances from the drawings, they identified several opportunities:
- The team found that the current design used a high-strength steel alloy for the entire assembly. However, analysis showed that a cheaper alloy with similar properties could be used for non-critical components, reducing material costs by 20%.
- Tolerance analysis revealed that several dimensions had unnecessarily tight tolerances. By selectively loosening tolerances on non-critical features, the team reduced manufacturing costs by 10% without affecting functionality.
- The team also used drawing data to optimize the assembly process. They identified components that could be redesigned for easier assembly and reduced the number of fasteners by 30%. These changes cut assembly time by 25%.
Overall, by leveraging engineering drawing data, the aerospace manufacturer’s VAVE team achieved a 15% cost reduction on the landing gear assembly without compromising quality or safety. They also developed a repeatable process for analyzing drawings that they could apply to other components and products.
This case study demonstrates the tangible impact that drawing data analysis can have on VAVE outcomes. By providing objective insights and evidence-based recommendations, drawing data helps VAVE teams drive measurable results and prove the value of their efforts.
How CADDi Drawer can help leveraging drawing data
In conclusion, leveraging engineering drawing data is essential for successful VAVE initiatives. By analyzing material usage, tolerances, assembly, failure modes, and manufacturing processes, VAVE teams can identify high-impact opportunities to reduce costs and improve value.
However, effectively leveraging drawing data requires the right tools and expertise. Companies need robust data extraction and analysis capabilities to unlock the full potential of their drawing assets. This involves investing in specialized software, training, and talent.
One powerful tool that enables companies to fully leverage their engineering drawing data is CADDi Drawer. This innovative software platform provides comprehensive capabilities for extracting, analyzing, and managing data from both digital and physical drawings.
A key feature of CADDi Drawer is its ability to automatically scan and extract data from PDF drawings. It can capture all the critical information, including dimensions, text, and shapes, even from handwritten drawings. This digitization unlocks previously inaccessible data and makes it searchable and comparable.
Moreover, CADDi Drawer allows companies to easily connect their drawing data with other relevant information from across the supply chain. Users can upload CSV files to link drawings with associated data such as costs, quantities, supplier details, sales prices, and cost breakdowns. The platform also integrates with ERP systems, CAM and CAD software, quality reports, and spec sheets. This integration provides a holistic view of each drawing in the context of the broader business.
Another powerful capability of CADDi Drawer is its search functionality. Users can search their entire historical drawing archive using any keyword, including material types, sizes, designer names, part names, and notes. The platform’s patented similarity search technology goes even further by identifying the shape of each part and finding similar drawings, even from handwritten records up to 30 years old. Additionally, CADDi Drawer’s image search allows users to upload a photo of a sketch or physical drawing and find the most similar drawings in their digital archive.
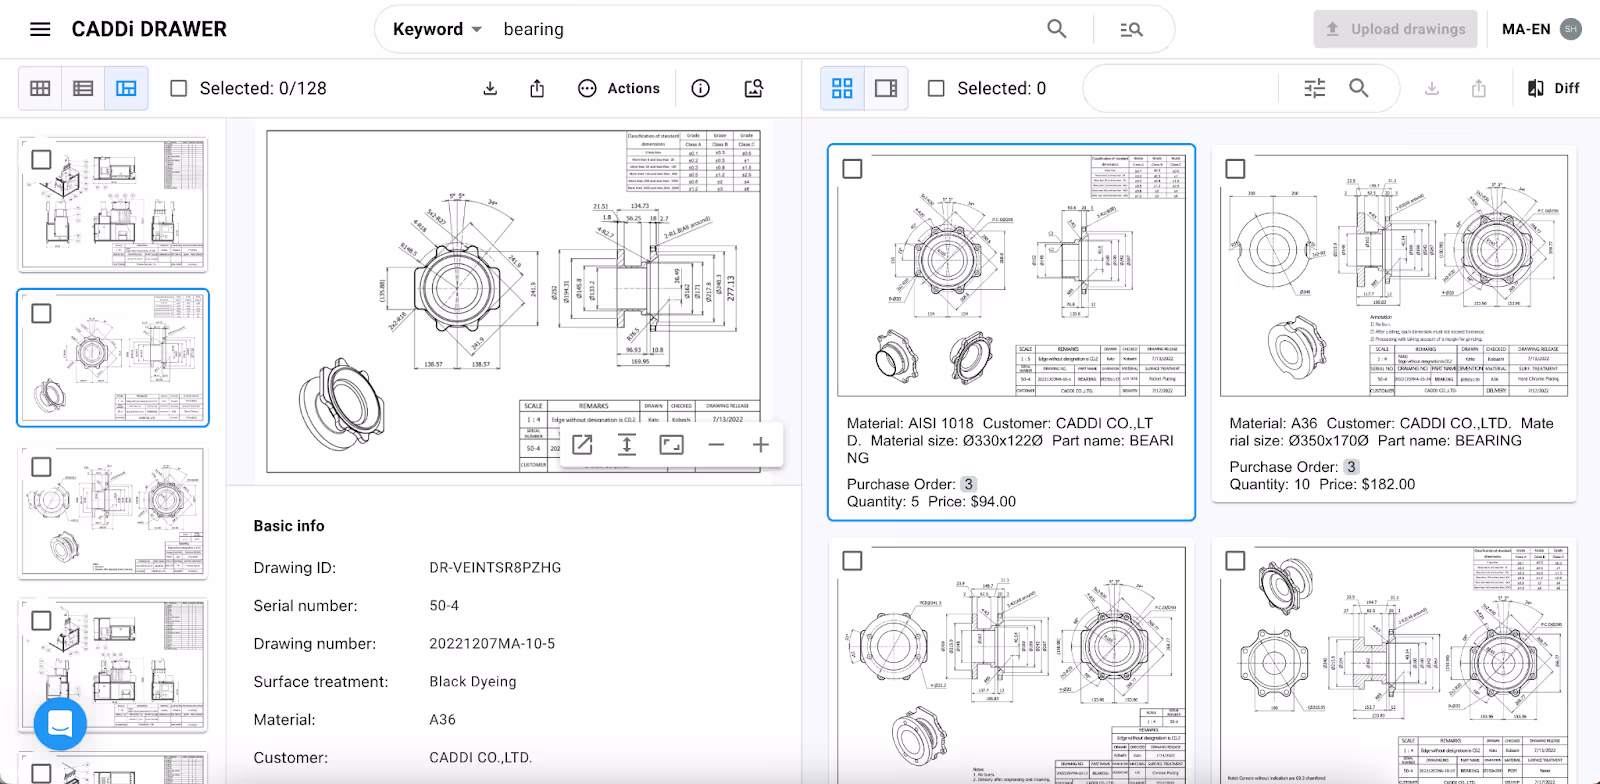
These robust search capabilities are particularly valuable for VAVE initiatives. Small design differences can often have large impacts on production costs. By identifying similar drawings with different pricing, CADDi Drawer enables engineers to easily find opportunities for value analysis and optimization.
Introduction
Value Analysis / Value Engineering (VAVE) initiatives aim to optimize the value of products, projects, or services. Analyzing data from technical drawings is becoming increasingly important for successful VAVE implementation.
Technical drawings contain a wealth of information about a product’s materials, dimensions, assembly, and manufacturing processes. With the rise of digital drawings and 3D models, even more data can be extracted. Leveraging this data enables fact-based decision making to reduce costs, improve quality, and maximize value.
For example, drawing data can reveal material usage rates for cost reduction opportunities. It can also show potential failure points or manufacturing difficulties. Applying data insights proactively during VAVE prevents issues down the line. Overall, drawing analytics provide tangible evidence to guide impactful changes while preserving functionality.
As data utilization expands across industries, integrating drawing analytics into VAVE provides a competitive advantage. Companies that leverage this data will make smarter value improvements and outperform peers. The future success of VAVE relies on capitalizing on these rich data sources.
Practices to Utilize Engineering Drawing Data in VAVE
1. Material Usage Analysis
One key practice is analyzing material usage from engineering drawings. By extracting material specifications and dimensions, VAVE teams can calculate the precise quantities of materials used in a product. This enables identifying opportunities to:
- Reduce material usage without compromising functionality
- Substitute cheaper materials with similar properties
- Optimize material allocation across components
- Negotiate better prices through bulk purchasing
For example, a vehicle manufacturer used drawing data to identify that they could reduce the thickness of a car door panel by 10% while maintaining structural integrity. This simple change saved millions in annual material costs.
2. Tolerance Analysis
Another valuable practice is tolerance analysis. Engineering drawings specify the acceptable range of variation for each dimension. Tight tolerances require more precise manufacturing, which increases costs. VAVE teams can use tolerance data to:
- Identify unnecessarily tight tolerances
- Determine the impact of loosening tolerances on functionality
- Optimize tolerances for critical vs. non-critical components
- Reduce manufacturing costs through looser tolerances
For instance, a machinery manufacturer analyzed tolerances across their product line. They found that 80% of components had tighter tolerances than necessary. By selectively loosening tolerances, they reduced manufacturing costs by 15% without affecting quality.
3. Assembly Optimization
Engineering drawings also provide crucial data about product assembly. VAVE teams can use this information to streamline assembly processes and reduce costs. Key opportunities include:
- Minimizing the number of components
- Simplifying component designs for easier assembly
- Optimizing the assembly sequence
- Identifying opportunities for automation
One electronics company used drawing data to analyze their circuit board assembly process. They identified components that could be consolidated and redesigned the board layout for robotic assembly. These changes cut assembly time by 30% and reduced defects.
4. Failure Mode Analysis
Drawing data can also help predict and prevent potential failure modes. By analyzing how components interact and identifying high-stress areas, VAVE teams can proactively address issues. This involves:
- Conducting finite element analysis (FEA) to simulate stresses
- Identifying potential failure points from drawing geometry
- Redesigning components to distribute stresses evenly
- Specifying more durable materials in high-wear areas
A medical device company used FEA on their product drawings to identify a potential failure point in a critical valve component. They redesigned the valve housing and specified a stronger material. These changes prevented costly recalls and lawsuits.
5. Manufacturing Process Optimization
Finally, engineering drawings contain valuable data for optimizing manufacturing processes. VAVE teams can use this information to:
- Identify components suitable for different manufacturing methods
- Optimize designs for manufacturability
- Reduce setup times and changeovers
- Minimize scrap and rework
For example, a furniture manufacturer analyzed their product drawings and identified components that could be produced using CNC machining instead of manual woodworking. They redesigned these components and invested in CNC equipment. This change reduced manufacturing time by 50% and improved quality consistency.
Case Study: Aerospace Manufacturer
To illustrate the power of leveraging engineering drawing data for VAVE, consider the case of a leading aerospace manufacturer. The company was facing intense pressure to reduce costs while maintaining strict quality and safety standards.
The VAVE team decided to focus on analyzing engineering drawings for a key component: the landing gear assembly. By extracting material specifications, dimensions, and tolerances from the drawings, they identified several opportunities:
- The team found that the current design used a high-strength steel alloy for the entire assembly. However, analysis showed that a cheaper alloy with similar properties could be used for non-critical components, reducing material costs by 20%.
- Tolerance analysis revealed that several dimensions had unnecessarily tight tolerances. By selectively loosening tolerances on non-critical features, the team reduced manufacturing costs by 10% without affecting functionality.
- The team also used drawing data to optimize the assembly process. They identified components that could be redesigned for easier assembly and reduced the number of fasteners by 30%. These changes cut assembly time by 25%.
Overall, by leveraging engineering drawing data, the aerospace manufacturer’s VAVE team achieved a 15% cost reduction on the landing gear assembly without compromising quality or safety. They also developed a repeatable process for analyzing drawings that they could apply to other components and products.
This case study demonstrates the tangible impact that drawing data analysis can have on VAVE outcomes. By providing objective insights and evidence-based recommendations, drawing data helps VAVE teams drive measurable results and prove the value of their efforts.
How CADDi Drawer can help leveraging drawing data
In conclusion, leveraging engineering drawing data is essential for successful VAVE initiatives. By analyzing material usage, tolerances, assembly, failure modes, and manufacturing processes, VAVE teams can identify high-impact opportunities to reduce costs and improve value.
However, effectively leveraging drawing data requires the right tools and expertise. Companies need robust data extraction and analysis capabilities to unlock the full potential of their drawing assets. This involves investing in specialized software, training, and talent.
One powerful tool that enables companies to fully leverage their engineering drawing data is CADDi Drawer. This innovative software platform provides comprehensive capabilities for extracting, analyzing, and managing data from both digital and physical drawings.
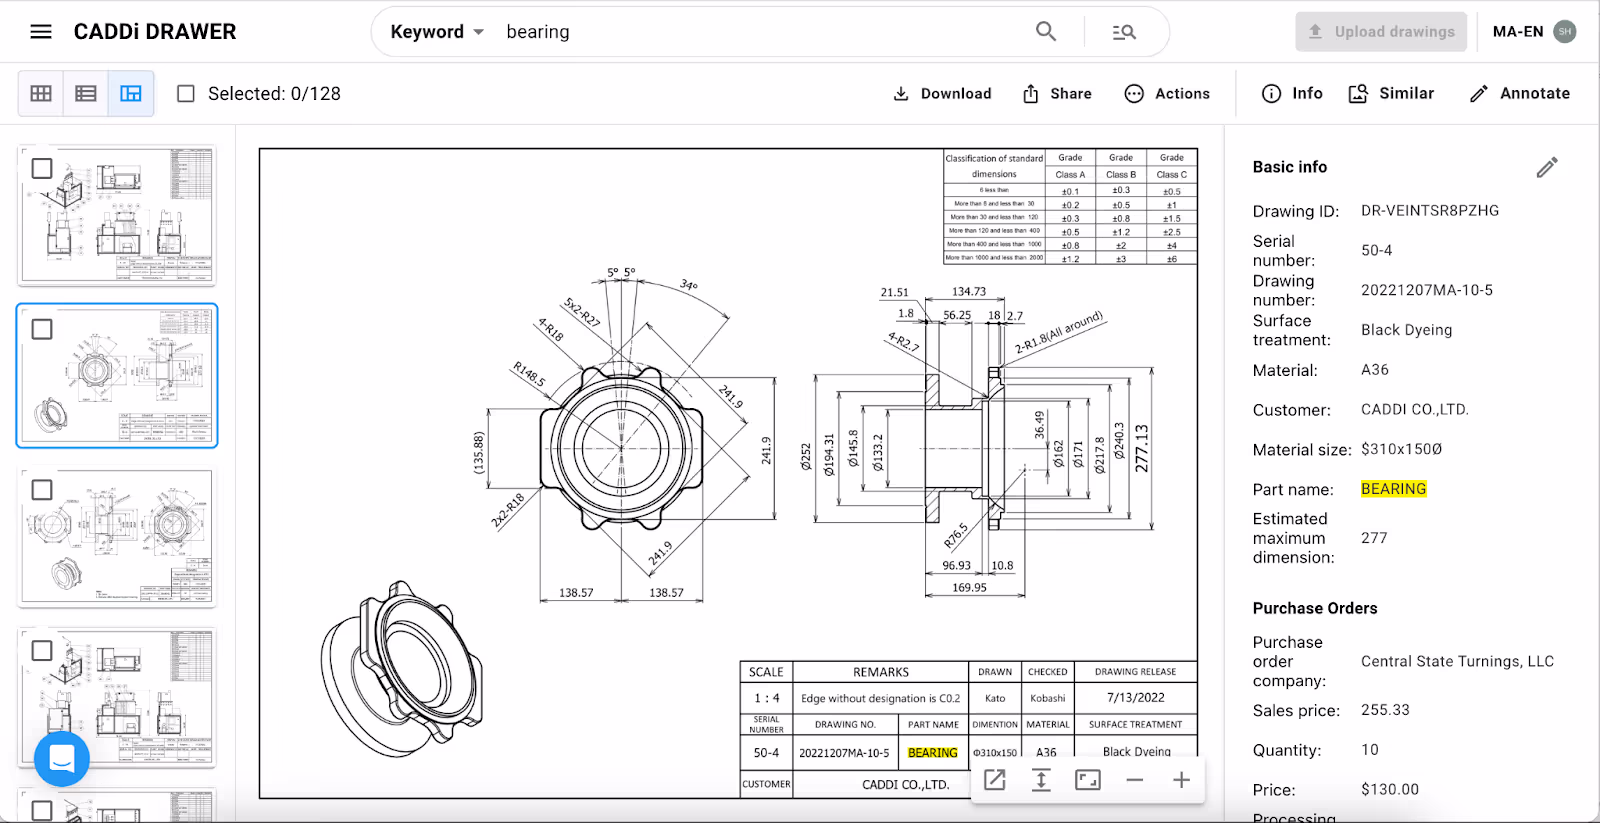
A key feature of CADDi Drawer is its ability to automatically scan and extract data from PDF drawings. It can capture all the critical information, including dimensions, text, and shapes, even from handwritten drawings. This digitization unlocks previously inaccessible data and makes it searchable and comparable.
Moreover, CADDi Drawer allows companies to easily connect their drawing data with other relevant information from across the supply chain. Users can upload CSV files to link drawings with associated data such as costs, quantities, supplier details, sales prices, and cost breakdowns. The platform also integrates with ERP systems, CAM and CAD software, quality reports, and spec sheets. This integration provides a holistic view of each drawing in the context of the broader business.
Another powerful capability of CADDi Drawer is its search functionality. Users can search their entire historical drawing archive using any keyword, including material types, sizes, designer names, part names, and notes. The platform’s patented similarity search technology goes even further by identifying the shape of each part and finding similar drawings, even from handwritten records up to 30 years old. Additionally, CADDi Drawer’s image search allows users to upload a photo of a sketch or physical drawing and find the most similar drawings in their digital archive.
These robust search capabilities are particularly valuable for VAVE initiatives. Small design differences can often have large impacts on production costs. By identifying similar drawings with different pricing, CADDi Drawer enables engineers to easily find opportunities for value analysis and optimization.
Ready to see CADDi Drawer in action? Get a personalized demo.
Subscribe to our Blog!
.svg)
.svg)
.svg)

Related Resources