.svg)

How to Leverage Drawing Data for Quality Control

Table of Contents

Introduction to Drawing Data for Quality Control
Drawing data refers to the detailed specifications, measurements, dimensions, and tolerances that are documented in technical drawings and blueprints. This data provides crucial information for manufacturing products to meet quality standards. Quality control is the process of ensuring products adhere to predetermined quality metrics and specifications.
Drawing data is essential for effective quality control in manufacturing. The drawings contain the engineering requirements that define what a quality product should be. By analyzing real-world measurements and production data against the drawing specifications, manufacturers can identify deviations, inconsistencies, and areas for improvement.
The key processes involved with using drawing data for quality control include:
- Documenting product specifications and tolerances in technical drawings
- Inspecting and measuring manufactured products
- Collecting and recording data during production
- Comparing the data to drawing requirements
- Identifying differences, defects, and anomalies
- Analyzing the findings to determine root causes
- Implementing solutions to improve consistency and reduce defects
Properly leveraging drawing data is vital for gaining visibility into the manufacturing process and ensuring optimal quality. This provides the feedback needed to control quality variances and continuously improve.
Gathering Accurate Drawing Data
Precise drawing data is essential for effective quality control. There are several key steps to ensure the data collected is complete and accurate. Following these best practices when gathering drawing data will result in the accurate, complete dataset required for quality control. Avoiding errors and inaccuracies early prevents defects down the line.
- Utilize CAD models and drawings as the primary source for specifications. Manual measurements can introduce errors.
- Double check that all necessary tolerances, dimensions, notes, and specifications are included in the CAD drawings. Missing information will lead to defects.
- Validate the CAD models by having multiple engineers review the drawings. Cross-checking helps catch mistakes.
- Define a change management process for updating drawings. Document all revisions and changes to avoid confusion.
- Perform in-process checks of early samples to catch drawing errors before full production. This verifies specifications match intent.
- Train inspection staff on properly interpreting drawings and conducting measurements. Misinterpretation of tolerances is a common source of problems.
- Use the right measurement tools and calibrate equipment regularly. Out-of-calibration tools will provide inaccurate data.
- Document any discrepancies found between drawings and physical parts. Drawings may need revision to match reality.
- Analyze measurement data for anomalies that could indicate measurement mistakes. Have multiple operators take samples to check for errors.
Analyzing the Drawing Data
Analyzing the drawing data is crucial for identifying quality issues and areas for improvement. There are several key steps in analyzing the data:
- Statistical methods to identify trends and outliers in datasets – Use statistical techniques like control charts, regression analysis, and hypothesis testing to detect anomalies, patterns, and trends in the drawing data. This allows you to pinpoint problems areas. Control charts are especially useful for monitoring process stability over time.
- Checking drawings against product requirements and specifications – Methodically review drawings and verify that all features and dimensions meet the specifications outlined in the product design requirements. Check for errors, inconsistencies, and missing information. Trace measurements back to the source requirements.
- Using software tools for analyzing large datasets – With large numbers of drawings, manually checking and analyzing data can be cumbersome. Use quality management software platforms to quickly compile, organize and analyze datasets. Look for tools with statistical process control (SPC) and data visualization capabilities to efficiently identify issues and their root causes. Integrate these systems with product life cycle management software.
Implementing Improvements
Drawing data analysis provides invaluable insights that can be used to implement tangible improvements in manufacturing quality and efficiency. Here are some key ways the findings can drive positive change:
Modifying Manufacturing Processes
The data may reveal certain production steps that are prone to higher defect rates or inconsistencies. Manufacturing engineers can modify these processes to reduce errors. For example, if dimension callouts for a hole diameter show excess variance, the drilling operation could be improved with fixtures, jigs or CNC programming tweaks.
Providing Feedback to Design Teams
Analysis may uncover drawing features that are difficult to manufacture consistently. Communicating these insights to designers enables them to modify the CAD model and drawings for better manufacturability. An example is minimum radii that are too tight for tool access. Increasing the radii slightly would enable higher quality production.
Data-Driven Improvements
The right data insights empower fact-based changes that improve quality and efficiency. Drawing analysis is key for continuous improvement. Specific cases where data analysis directly led to quality improvements include:
- Reducing slot width tolerance by 0.005″ after data showed production was capable of holding tighter consistency. This prevented over-engineering and material waste.
- Catching an error in a hole callout that was fixed on the CAD model, preventing further production of the wrong hole size.
- Adjusting surface finish callouts based on study of actual manufactured part appearance requirements. This enabled switching to a less costly finishing method without sacrificing quality.
Maintaining Consistent Quality Standards
Gathering and analyzing drawing data is important for identifying quality issues, but maintaining high standards requires ongoing effort. Companies should implement processes to regularly review drawing data and find new areas for improvement.
Some best practices include:
- Conducting regular data reviews: Schedule periodic reviews of drawing data to spot negative trends or new issues. Daily or weekly reviews help address problems quickly before major quality failures occur.
- Continuous improvement processes: Use methods like Six Sigma and Lean Manufacturing to continuously gather data, analyze root causes, and implement solutions. Make improvement an everyday priority across the organization.
- Quality assurance systems: Automated QA software can flag drawings that don’t meet specifications. This helps catch problems early. Integrate QA into engineering workflows.
- Training programs: Educate teams on properly generating, gathering, and using drawing data. Update training when processes change. Foster a culture focused on quality.
With diligent effort, companies can use drawing data to maintain high quality standards over the long term. The key is instilling quality as an organizational priority and giving employees the tools and knowledge to identify and prevent problems.
How CADDi Drawer can streamline quality control
CADDi Drawer is a powerful tool that can significantly enhance quality control processes by efficiently managing and analyzing drawing data. Its features streamline the gathering, organizing, and leveraging of drawing information to identify quality issues and drive improvements.
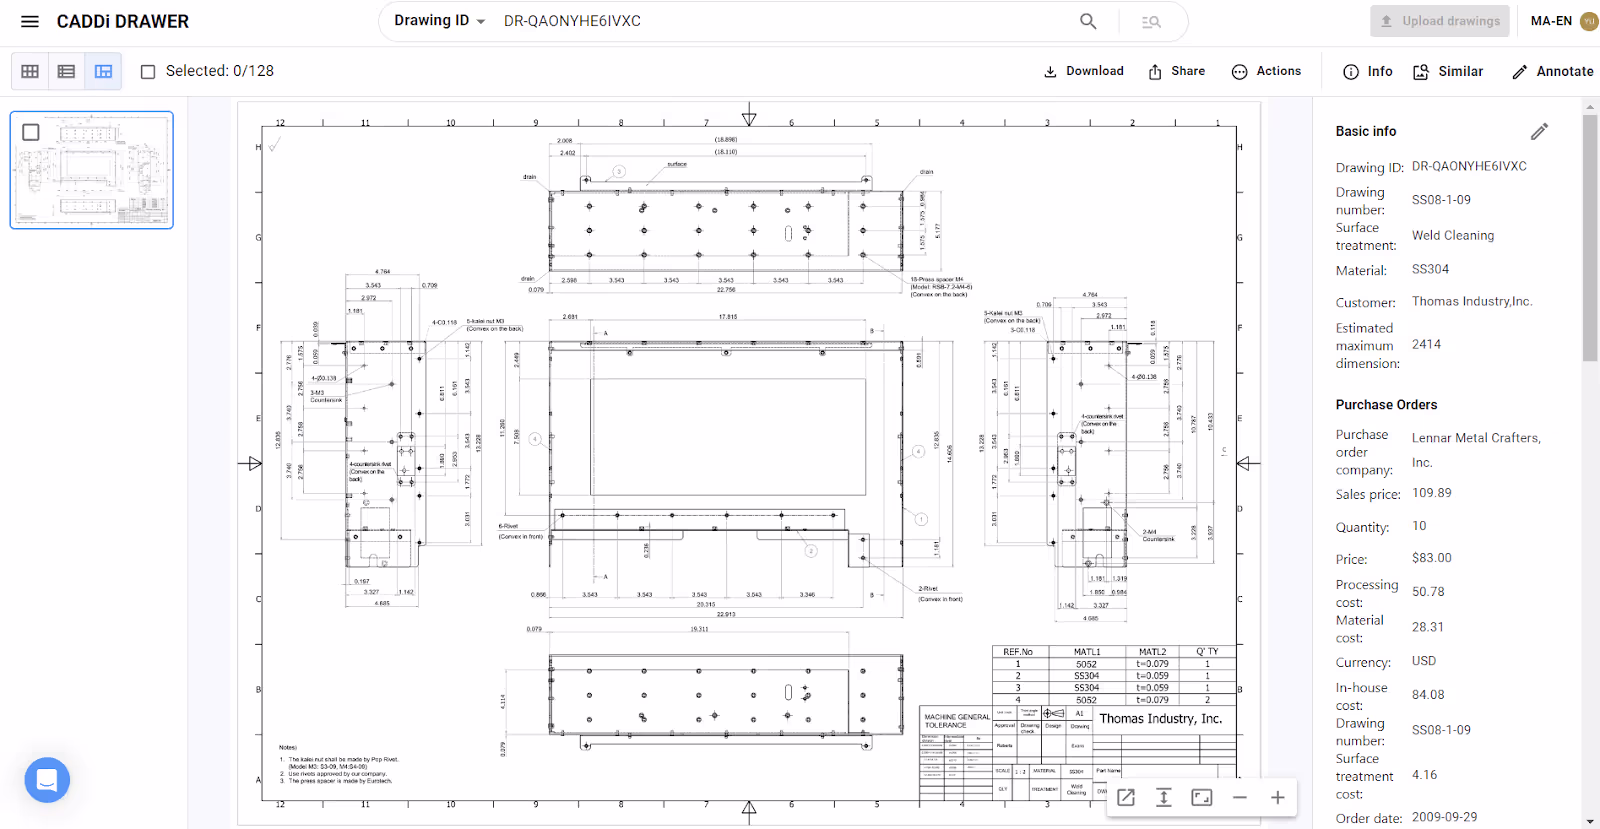
Auto Scanning of PDF Drawings
CADDi Drawer automatically extracts all data from drawings, including dimensions, text, and shapes. It can even convert handwritten drawings to be searchable and comparable.
This automation saves time and reduces manual data entry errors, ensuring a more accurate and complete dataset for quality control analysis.
Connecting Supply-Chain Data to Drawings
By allowing users to easily upload CSV files, CADDi Drawer connects all relevant information to the associated drawings. This includes cost, quantity, supplier information, sales price, cost breakdown, and more. It can also integrate with ERP data, CAM, CAD, quality defect reports, and spec sheets automatically.
Having all this data linked to the drawings provides valuable context for identifying root causes of quality issues and implementing targeted improvements.
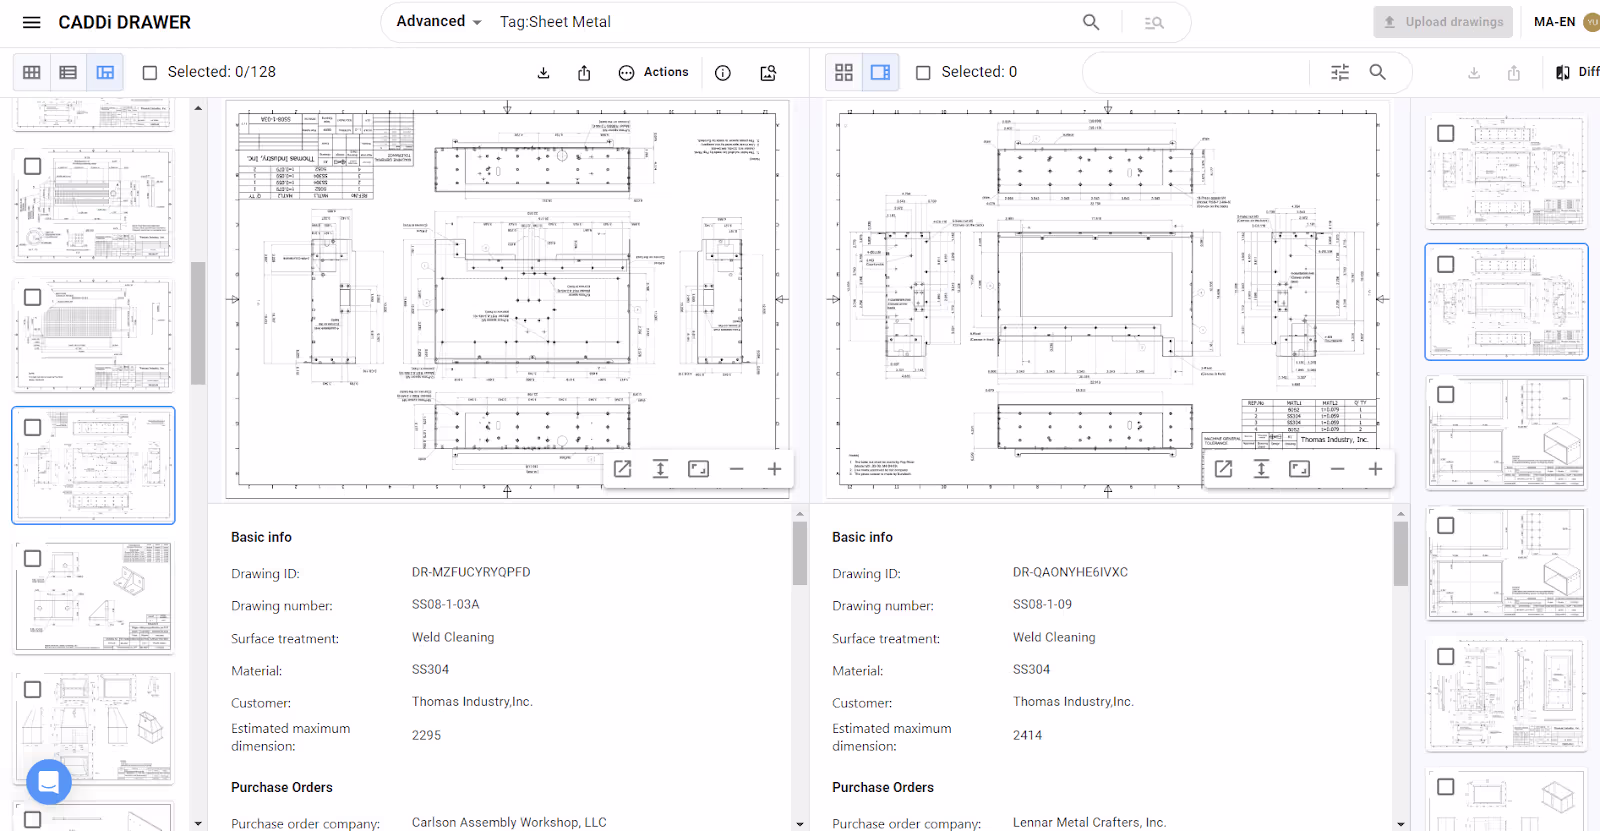
Comprehensive Search Capabilities
CADDi Drawer offers multiple ways to search and find relevant drawings quickly. Users can search the entire historical drawing archive using keywords like material, size, designer’s name, part name, and notes. The platform’s patented similarity search technology identifies the shape of each part to find similar drawings, even from handwritten drawings created decades ago.
These search features enable quality teams to efficiently locate and compare drawings to identify patterns and potential issues. Whenever new quality issues are encountered, teams can search for similar drawings to identify the potential risk of similar defects occurring in related parts.
By removing departmental silos and linking quality defect information with drawings, CADDi Drawer helps quality control teams to share feedback to engineers and avoid repeating the same mistakes in new designs.
Introduction to Drawing Data for Quality Control
Drawing data refers to the detailed specifications, measurements, dimensions, and tolerances that are documented in technical drawings and blueprints. This data provides crucial information for manufacturing products to meet quality standards. Quality control is the process of ensuring products adhere to predetermined quality metrics and specifications.
Drawing data is essential for effective quality control in manufacturing. The drawings contain the engineering requirements that define what a quality product should be. By analyzing real-world measurements and production data against the drawing specifications, manufacturers can identify deviations, inconsistencies, and areas for improvement.
The key processes involved with using drawing data for quality control include:
- Documenting product specifications and tolerances in technical drawings
- Inspecting and measuring manufactured products
- Collecting and recording data during production
- Comparing the data to drawing requirements
- Identifying differences, defects, and anomalies
- Analyzing the findings to determine root causes
- Implementing solutions to improve consistency and reduce defects
Properly leveraging drawing data is vital for gaining visibility into the manufacturing process and ensuring optimal quality. This provides the feedback needed to control quality variances and continuously improve.
Gathering Accurate Drawing Data
Precise drawing data is essential for effective quality control. There are several key steps to ensure the data collected is complete and accurate. Following these best practices when gathering drawing data will result in the accurate, complete dataset required for quality control. Avoiding errors and inaccuracies early prevents defects down the line.
- Utilize CAD models and drawings as the primary source for specifications. Manual measurements can introduce errors.
- Double check that all necessary tolerances, dimensions, notes, and specifications are included in the CAD drawings. Missing information will lead to defects.
- Validate the CAD models by having multiple engineers review the drawings. Cross-checking helps catch mistakes.
- Define a change management process for updating drawings. Document all revisions and changes to avoid confusion.
- Perform in-process checks of early samples to catch drawing errors before full production. This verifies specifications match intent.
- Train inspection staff on properly interpreting drawings and conducting measurements. Misinterpretation of tolerances is a common source of problems.
- Use the right measurement tools and calibrate equipment regularly. Out-of-calibration tools will provide inaccurate data.
- Document any discrepancies found between drawings and physical parts. Drawings may need revision to match reality.
- Analyze measurement data for anomalies that could indicate measurement mistakes. Have multiple operators take samples to check for errors.
Analyzing the Drawing Data
Analyzing the drawing data is crucial for identifying quality issues and areas for improvement. There are several key steps in analyzing the data:
- Statistical methods to identify trends and outliers in datasets – Use statistical techniques like control charts, regression analysis, and hypothesis testing to detect anomalies, patterns, and trends in the drawing data. This allows you to pinpoint problems areas. Control charts are especially useful for monitoring process stability over time.
- Checking drawings against product requirements and specifications – Methodically review drawings and verify that all features and dimensions meet the specifications outlined in the product design requirements. Check for errors, inconsistencies, and missing information. Trace measurements back to the source requirements.
- Using software tools for analyzing large datasets – With large numbers of drawings, manually checking and analyzing data can be cumbersome. Use quality management software platforms to quickly compile, organize and analyze datasets. Look for tools with statistical process control (SPC) and data visualization capabilities to efficiently identify issues and their root causes. Integrate these systems with product life cycle management software.
Implementing Improvements
Drawing data analysis provides invaluable insights that can be used to implement tangible improvements in manufacturing quality and efficiency. Here are some key ways the findings can drive positive change:
Modifying Manufacturing Processes
The data may reveal certain production steps that are prone to higher defect rates or inconsistencies. Manufacturing engineers can modify these processes to reduce errors. For example, if dimension callouts for a hole diameter show excess variance, the drilling operation could be improved with fixtures, jigs or CNC programming tweaks.
Providing Feedback to Design Teams
Analysis may uncover drawing features that are difficult to manufacture consistently. Communicating these insights to designers enables them to modify the CAD model and drawings for better manufacturability. An example is minimum radii that are too tight for tool access. Increasing the radii slightly would enable higher quality production.
Data-Driven Improvements
The right data insights empower fact-based changes that improve quality and efficiency. Drawing analysis is key for continuous improvement. Specific cases where data analysis directly led to quality improvements include:
- Reducing slot width tolerance by 0.005″ after data showed production was capable of holding tighter consistency. This prevented over-engineering and material waste.
- Catching an error in a hole callout that was fixed on the CAD model, preventing further production of the wrong hole size.
- Adjusting surface finish callouts based on study of actual manufactured part appearance requirements. This enabled switching to a less costly finishing method without sacrificing quality.
Maintaining Consistent Quality Standards
Gathering and analyzing drawing data is important for identifying quality issues, but maintaining high standards requires ongoing effort. Companies should implement processes to regularly review drawing data and find new areas for improvement.
Some best practices include:
- Conducting regular data reviews: Schedule periodic reviews of drawing data to spot negative trends or new issues. Daily or weekly reviews help address problems quickly before major quality failures occur.
- Continuous improvement processes: Use methods like Six Sigma and Lean Manufacturing to continuously gather data, analyze root causes, and implement solutions. Make improvement an everyday priority across the organization.
- Quality assurance systems: Automated QA software can flag drawings that don’t meet specifications. This helps catch problems early. Integrate QA into engineering workflows.
- Training programs: Educate teams on properly generating, gathering, and using drawing data. Update training when processes change. Foster a culture focused on quality.
With diligent effort, companies can use drawing data to maintain high quality standards over the long term. The key is instilling quality as an organizational priority and giving employees the tools and knowledge to identify and prevent problems.
How CADDi Drawer can streamline quality control
CADDi Drawer is a powerful tool that can significantly enhance quality control processes by efficiently managing and analyzing drawing data. Its features streamline the gathering, organizing, and leveraging of drawing information to identify quality issues and drive improvements.
Auto Scanning of PDF Drawings
CADDi Drawer automatically extracts all data from drawings, including dimensions, text, and shapes. It can even convert handwritten drawings to be searchable and comparable.
This automation saves time and reduces manual data entry errors, ensuring a more accurate and complete dataset for quality control analysis.
Connecting Supply-Chain Data to Drawings
By allowing users to easily upload CSV files, CADDi Drawer connects all relevant information to the associated drawings. This includes cost, quantity, supplier information, sales price, cost breakdown, and more. It can also integrate with ERP data, CAM, CAD, quality defect reports, and spec sheets automatically.
Having all this data linked to the drawings provides valuable context for identifying root causes of quality issues and implementing targeted improvements.
Comprehensive Search Capabilities
CADDi Drawer offers multiple ways to search and find relevant drawings quickly. Users can search the entire historical drawing archive using keywords like material, size, designer’s name, part name, and notes. The platform’s patented similarity search technology identifies the shape of each part to find similar drawings, even from handwritten drawings created decades ago.
These search features enable quality teams to efficiently locate and compare drawings to identify patterns and potential issues. Whenever new quality issues are encountered, teams can search for similar drawings to identify the potential risk of similar defects occurring in related parts.
By removing departmental silos and linking quality defect information with drawings, CADDi Drawer helps quality control teams to share feedback to engineers and avoid repeating the same mistakes in new designs.
Ready to see CADDi Drawer in action? Get a personalized demo.
Subscribe to our Blog!
.svg)
.svg)
.svg)

Related Resources